人工知能(AI)は医療画像解析に革新をもたらしていますが、その進歩には高品質で多様な大規模データセットが不可欠です。米国国立がん研究所(NCI)が提供するImaging Data Commons(IDC)は、この課題を克服し、AIツールの開発、検証、臨床応用を促進するための基盤となるプラットフォームです。IDCは、データの標準化、クラウドベースのリソース、そして透明性と再現性への重点を通じて、がん研究のブレークスルーを加速させることを目指しています。
AI医療画像解析の進化を支えるデータ基盤:NCI Imaging Data Commons(IDC)
どうも、Beyond the Pixelです。人工知能(AI)技術の目覚ましい進歩は、生体医用画像データの取得、解釈、分析に対する既存のアプローチに革命をもたらしています。しかし、AIツールを開発し、検証し、継続的に改善するためには、代表性と多様性を兼ね備えた、高品質でアノテーション(注釈)付きの大規模なデータセットへの容易なアクセスが不可欠です。この課題に応えるべく、米国国立がん研究所(NCI)はImaging Data Commons(IDC)を設立しました。IDCは、がん関連の公開画像データコレクションを大規模かつ多様にホストし、業界標準に基づいてすべてのデータを調和させ、分析および探索リソースと併置することで、AIツールの開発、検証、そして臨床応用を促進することを目指しています。これは、再現性があり透明性の高いAI処理パイプラインを確立するという、長年の課題に対処するための重要な取り組みです。
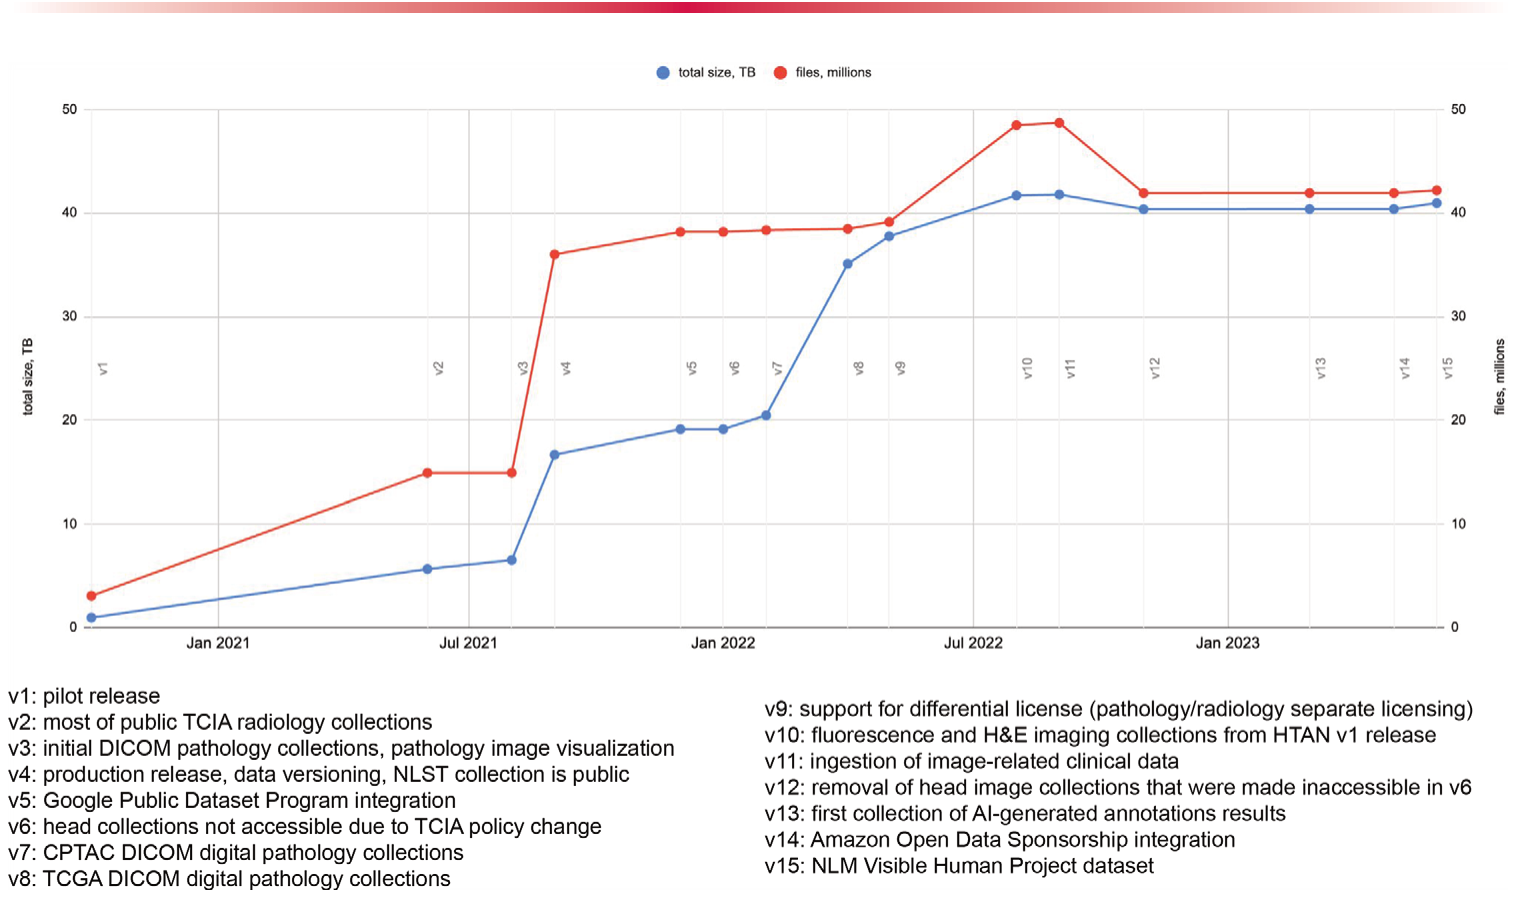
Figure 1. Figure 1. Annotated timeline of IDC data releases and major development milestones. An up-to-date version of the timeline is available in the IDC data release notes documentation page (19). CPTAC = The Clinical Proteomic Tumor Analysis Consortium, H&E = hematoxylin and eosin, HTAN = Human Tumor Atlas Network, NLM = National Library of Medicine, NLST = National Lung Screening Trial, TB = terabyte, TCGA = The Cancer Genome Atlas.解説: IDCのデータリリースと主要な開発マイルストーンを示す注釈付きのタイムラインです。最新のタイムラインはIDCのデータリリースノートで確認できます。
IDCがホストする画像および画像由来データ(アノテーション、関心領域のセグメンテーション、画像由来の特徴、分析結果など)は、全てネイティブにDICOM(Digital Imaging and Communications in Medicine)表現としてエンコードされるか、DICOMに調和されています。DICOMは元々放射線学の臨床ワークフローをサポートするために開発されましたが、相互運用性を可能にし、一貫したデータモデルとメタデータ規約を提供することで、他の画像タイプやアプリケーションもサポートする有用性を示しています。DICOM表現は、画像の検索と処理を可能にする豊富なメタデータを含んでいます。これにより、IDCは標準を実装する既製のツール(商業用およびオープンソースの両方)を利用でき、開発およびメンテナンスコストを削減し、分析ワークフローコンポーネントの再利用をサポートします。
IDCデータは、公開クラウドサービスを利用してホストされており、データの探索、検索、分析を効率化し、クラウドの柔軟性を活用してセキュリティとスケーラビリティを可能にします。IDCは、Google Cloud Platform(GCP)とAmazon Web Services(AWS)の両方が提供するサービスに依存しています。これにより、ユーザーはクラウドベースのツールを容易に利用できるだけでなく、自身の計算リソースでIDCデータを分析することも可能です。
IDCのデータコンテンツと機能
IDCは、様々な画像取得技術(例:放射線画像モダリティ、デジタル病理、多重蛍光イメージング)、デバイス、がんおよび組織タイプ、臓器システムにわたる67TB以上の画像データ(以前のバージョンを含む)を保有しています。初期には、The Cancer Imaging Archive(TCIA)によって既に匿名化されキュレートされた公開DICOM放射線コレクションの取り込みに注力していました。現在では、The Cancer Genome Atlas(TCGA)、The Clinical Proteomic Tumor Analysis Consortium(CPTAC)、National Lung Screening Trial(NLST)、Human Tumor Atlas Network(HTAN)といったイニシアチブによって収集されたデジタル病理コンポーネントなども含まれています。
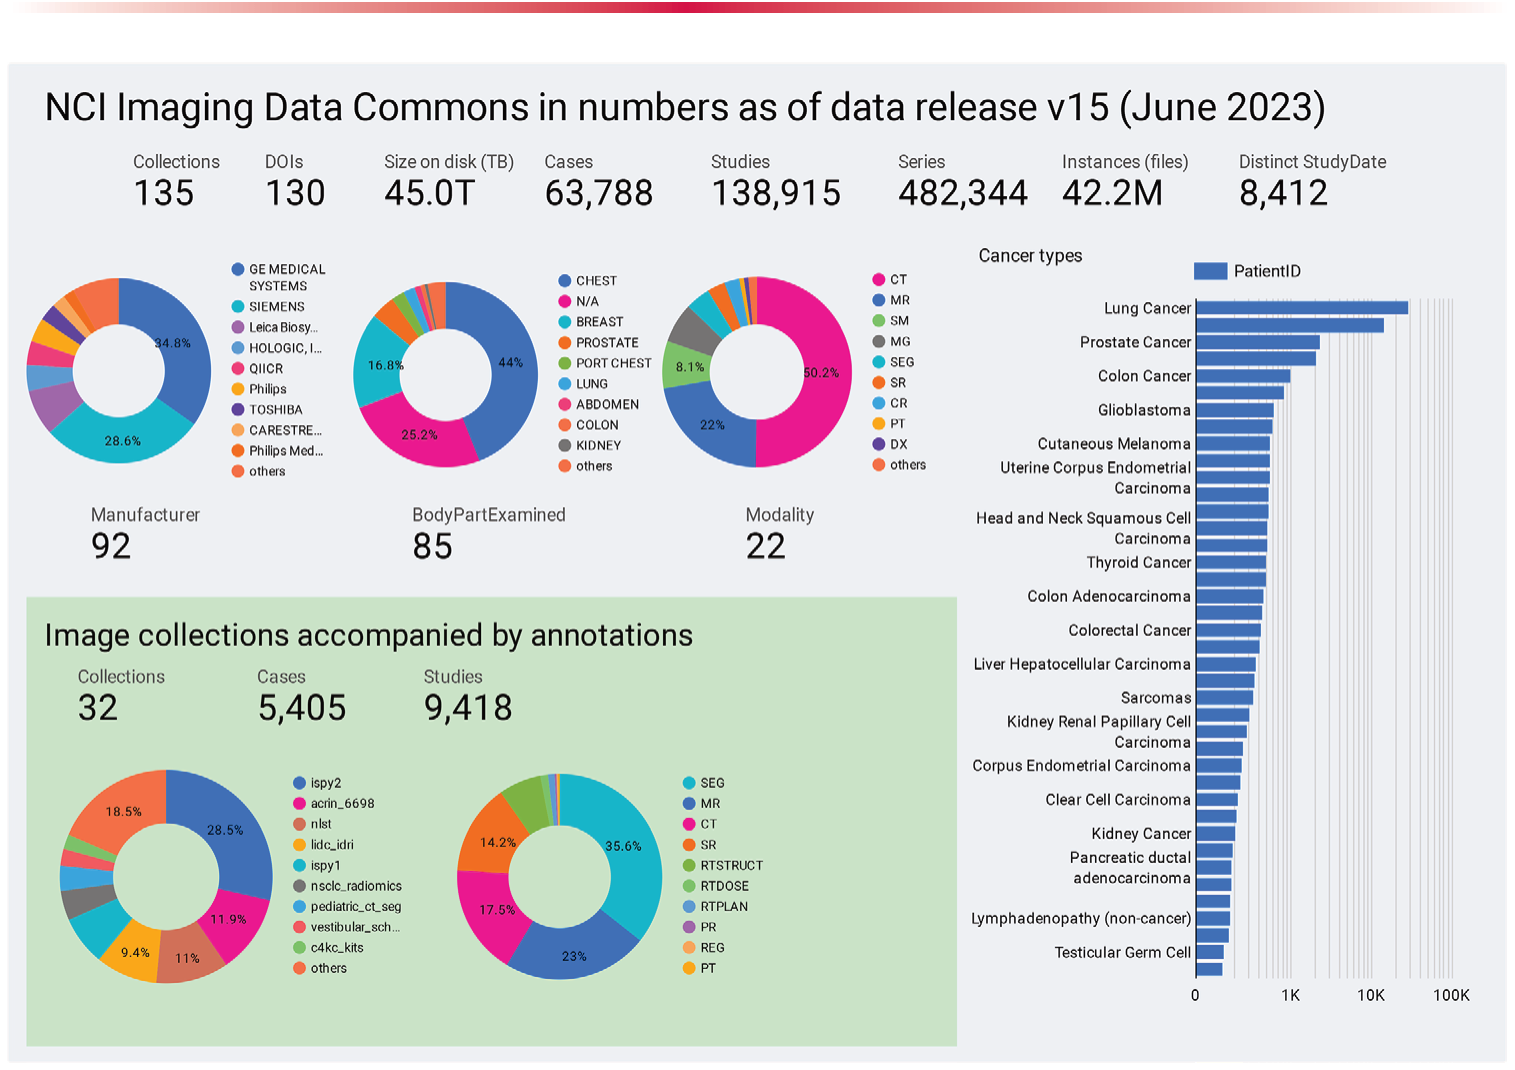
Figure 2. Figure 2. Chart shows a summary of the data available in IDC as of data release version 15 (June 2023). Note that the size on disk reported is in terabytes (TB) (1012 bytes). An interactive version of this summary dashboard is publicly available (21).解説: データリリースバージョン15(2023年6月時点)でIDCが利用可能としているデータの概要を示すチャートです。ディスク上のサイズはテラバイト(TB)で報告されています。
特に、NLM Visible Human Projectデータセットは、最近まで独占的なベンダーフォーマットでしか利用できませんでしたが、現在ではIDCで利用可能です。
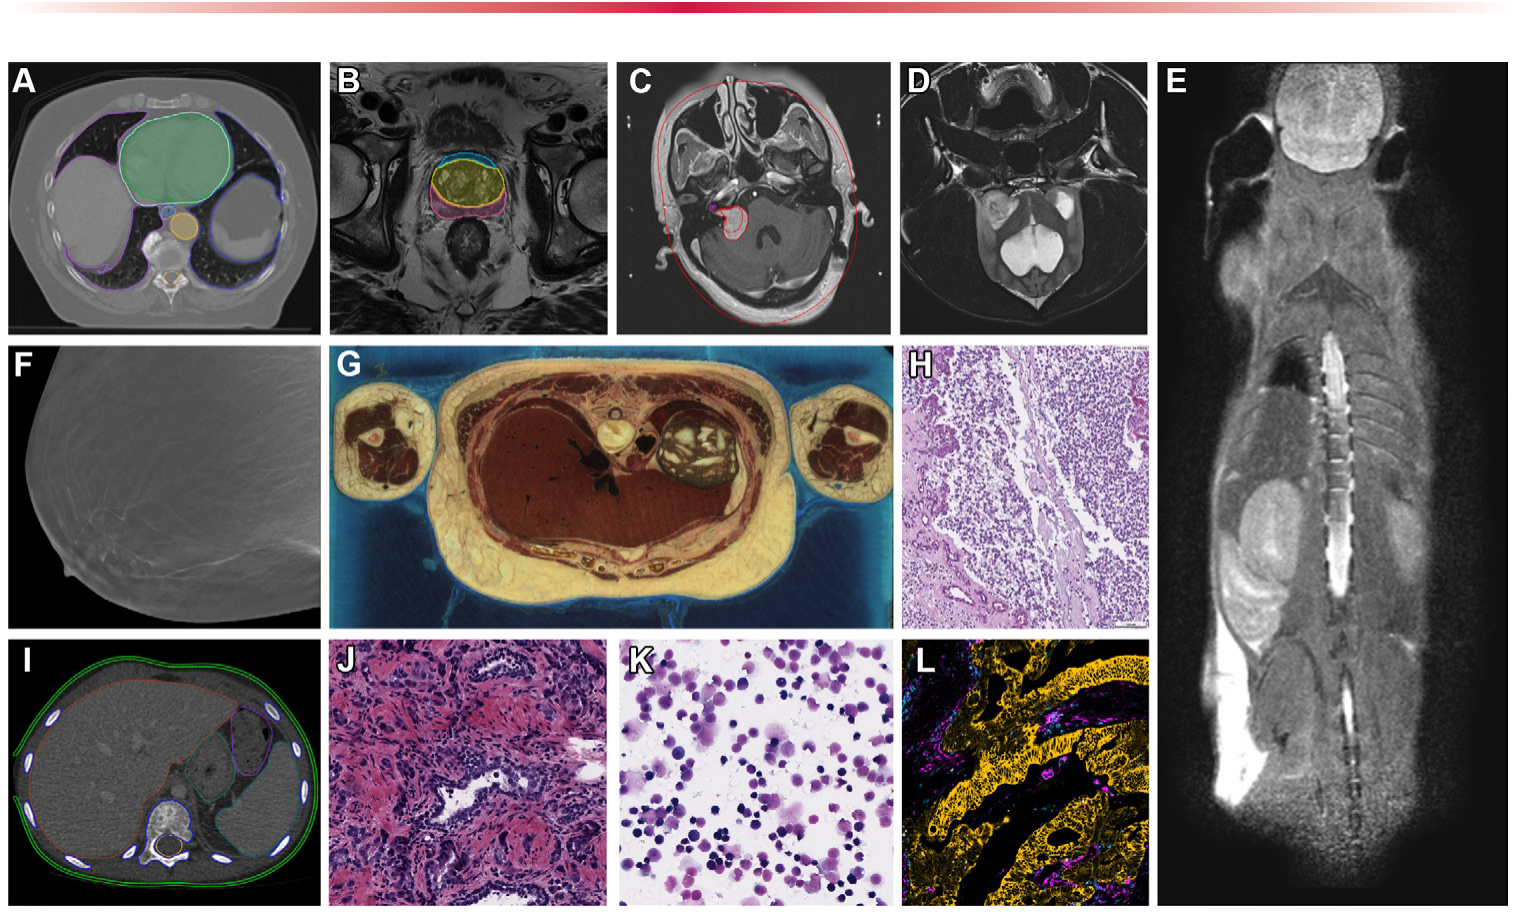
Figure 3. Figure 3. Representative images and image annotations available in IDC. (A) NSCLC-Radiomics (22) CT image shows lung cancer with manually annotated regions of interest and nnU-Net-BPR-Annotations (23) (AI-annotated regions of interest). NSCLC = non–small cell lung cancer. (B) PROSTATEx (24) MR image shows PROSTATEx-Seg-Zones (25), expert-annotated prostate anatomy zones. Seg = segmentation. (C) Vestibular-Schwannoma-SEG (26) MR image shows schwannoma with manually annotated regions of interest. (D) ICDC-Glioma (27) MR image shows canine glioma. ICDC = Integrated Canine Data Commons. (E) PDMR-997537-175-T MR image shows a mouse adenocarcinoma colon xenograft. PDMR = Patient-Derived Models Repository. (F) Breast-Cancer-Screen- ing-DBT (28) tomosynthesis image. DBT = digital breast tomosynthesis. (G) NLM-Visible-Human-Project (20) cryomacrotome anatomic image. (H) ICDC-Gli- oma (27) canine hematoxylin and eosin (H-E) stain digital pathology photomicrograph. (I) Pediatric-CT-SEG (29) pediatric CT image with expert-annotated organ contours. (J) TCGA-PRAD (5) H-E stain digital pathology photomicrograph shows prostate cancer. TCGA-PRAD = The Cancer Genome Atlas Prostate Adenocarcinoma. (K) CPTAC-AML (6) H-E stain digital pathology photomicrograph shows acute myeloid leukemia. CPTAC-AML = Clinical Proteomic Tumor Analysis Consortium Acute Myeloid Leukemia. (L) HTAN-HMS (7) multichannel fluorescence image with pan-cytokeratin, CD45, vimentin, and Ki67 channels selected. HTAN = Human Tumor Atlas Network.解説: IDCで利用可能な代表的な画像と画像アノテーションの例です。(A) NSCLC-RadiomicsのCT画像に手動でアノテーションされた肺がんの関心領域と、AIによってアノテーションされた関心領域。(B) PROSTATExのMR画像に専門家がアノテーションした前立腺の解剖学的ゾーン。(C) Vestibular-Schwannoma-SEGのMR画像に手動でアノテーションされた聴神経腫瘍の関心領域。(D) ICDC-GliomaのMR画像に示されるイヌの神経膠腫。(E) PDMR-997537-175-TのMR画像に示されるマウスの腺癌結腸異種移植片。(F) 乳がんスクリーニングDBTのトモシンセシス画像。(G) NLM-Visible-Human-Projectの凍結マクロトーム解剖画像。(H) ICDC-Gliomaのイヌのヘマトキシリン・エオシン(H-E)染色デジタル病理光顕写真。(I) 小児CT-SEGの小児CT画像に専門家がアノテーションした臓器の輪郭。(J) TCGA-PRADのH-E染色デジタル病理光顕写真に示される前立腺がん。(K) CPTAC-AMLのH-E染色デジタル病理光顕写真に示される急性骨髄性白血病。(L) HTAN-HMSの多重蛍光画像でパンサイトケラチン、CD45、ビメンチン、Ki67チャンネルが選択されています。
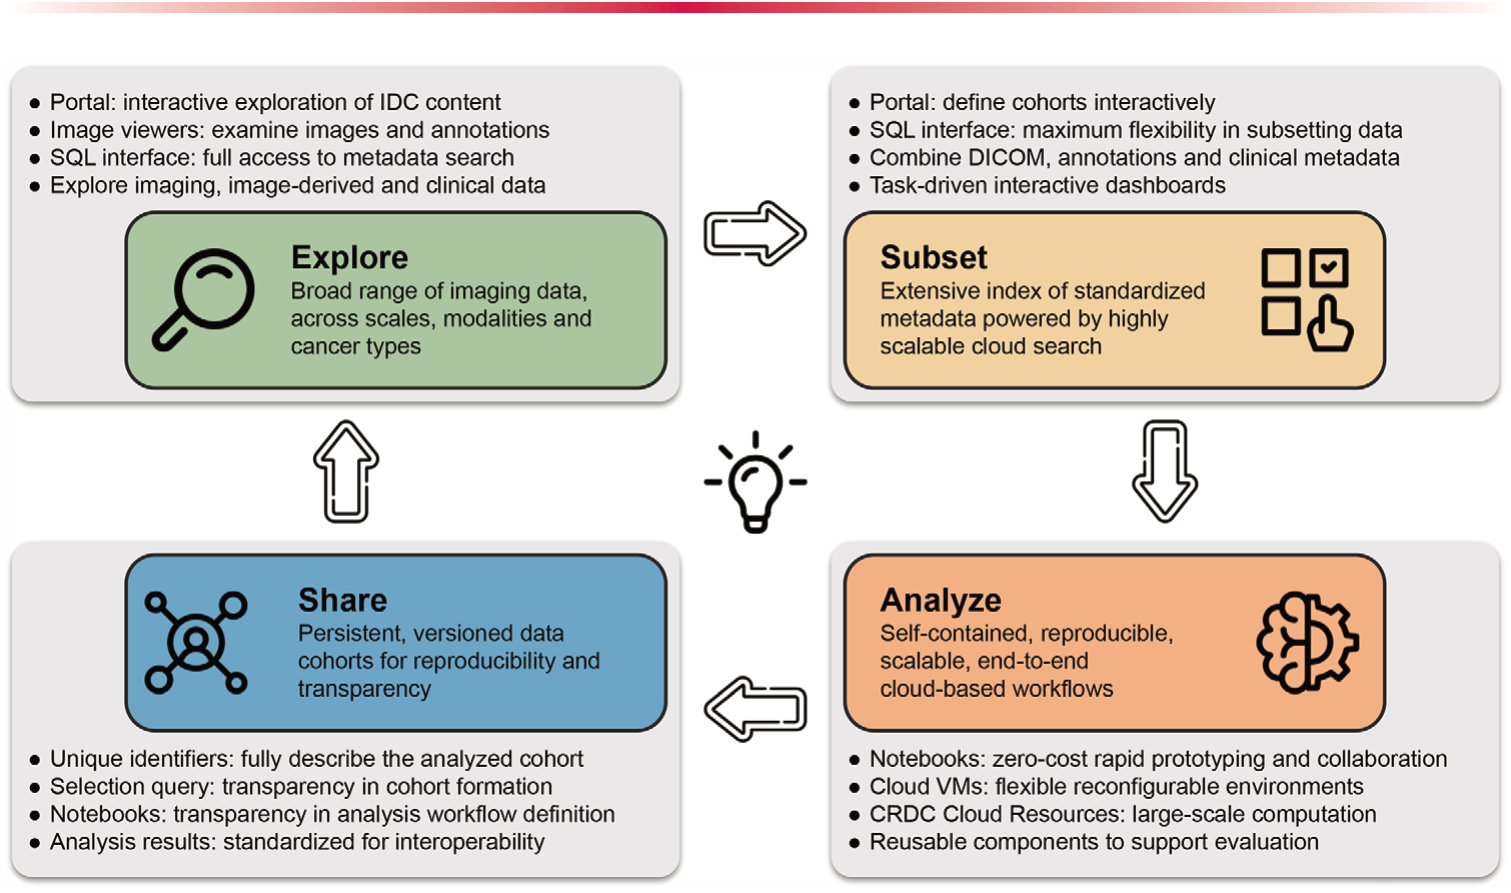
Figure 4. Figure 4. Conceptual summary of the capabilities provided by IDC and flowchart of the interactions of the target user with the platform. Each of the gray panels highlights the specific components available within IDC to support the corresponding capabilities. VM = virtual machine.解説: IDCが提供する機能の概念的な概要と、ターゲットユーザーがプラットフォームと対話するフローチャートです。各パネルは、対応する機能をサポートするためにIDC内で利用可能な特定のコンポーネントを強調しています。
探索(Explore): DICOM表現へのデータ変換は、データモデルとメタデータに基本的な統一性をもたらします。これにより、データとの対話時に一貫した選択基準を使用することが可能になります。IDCのウェブポータルアプリケーションは、IDCデータ探索のためのエントリーレベルのインターフェースを提供し、より詳細なデータはSQLインターフェースを通じて完全にアクセスできます。画像やアノテーションは、Open Health Imaging Foundation(OHIF)やSlimといったビューアを使って可視化できます。
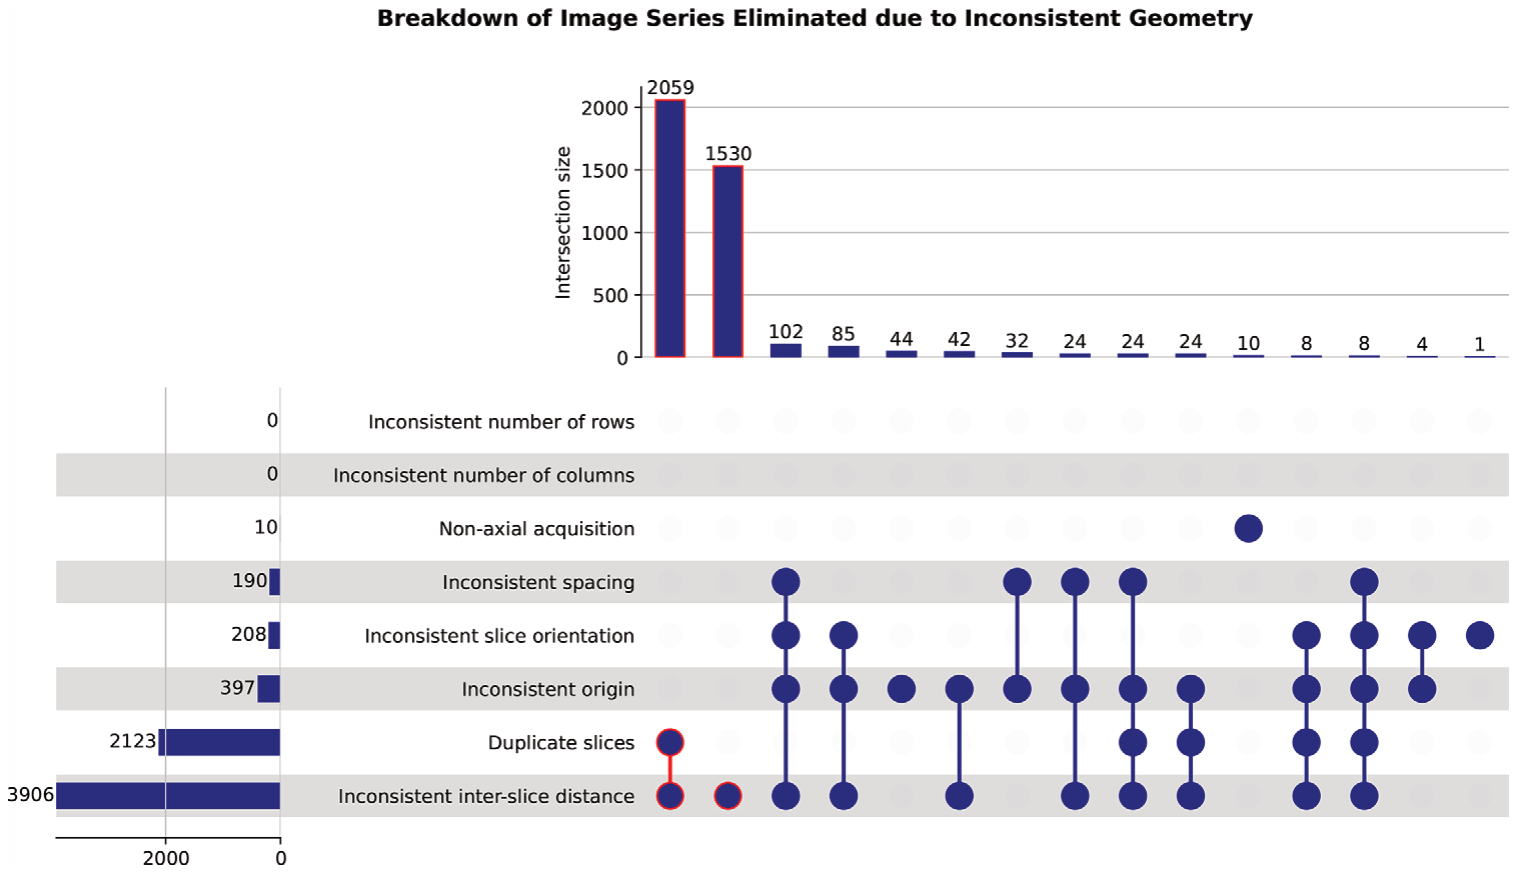
Figure 5. Figure 5. UpSet plots show the distributions of DICOM series from the National Lung Screening Trial (NLST) collection that were identified to have inconsis- tent geometry. Definition of the rules to identify these series was done by using an SQL statement against the DICOM metadata available in IDC. Items out- lined in red correspond to the DICOM series groups constituting the largest portion of those that have inconsistent geometry.解説: National Lung Screening Trial (NLST) コレクションから、不整合な形状を持つことが特定されたDICOMシリーズの分布を示すUpSetプロットです。これらのシリーズを特定するルールは、IDCで利用可能なDICOMメタデータに対するSQLステートメントを使用して定義されました。赤で囲まれた項目は、不整合な形状を持つシリーズの最大の割合を構成するDICOMシリーズグループに対応します。
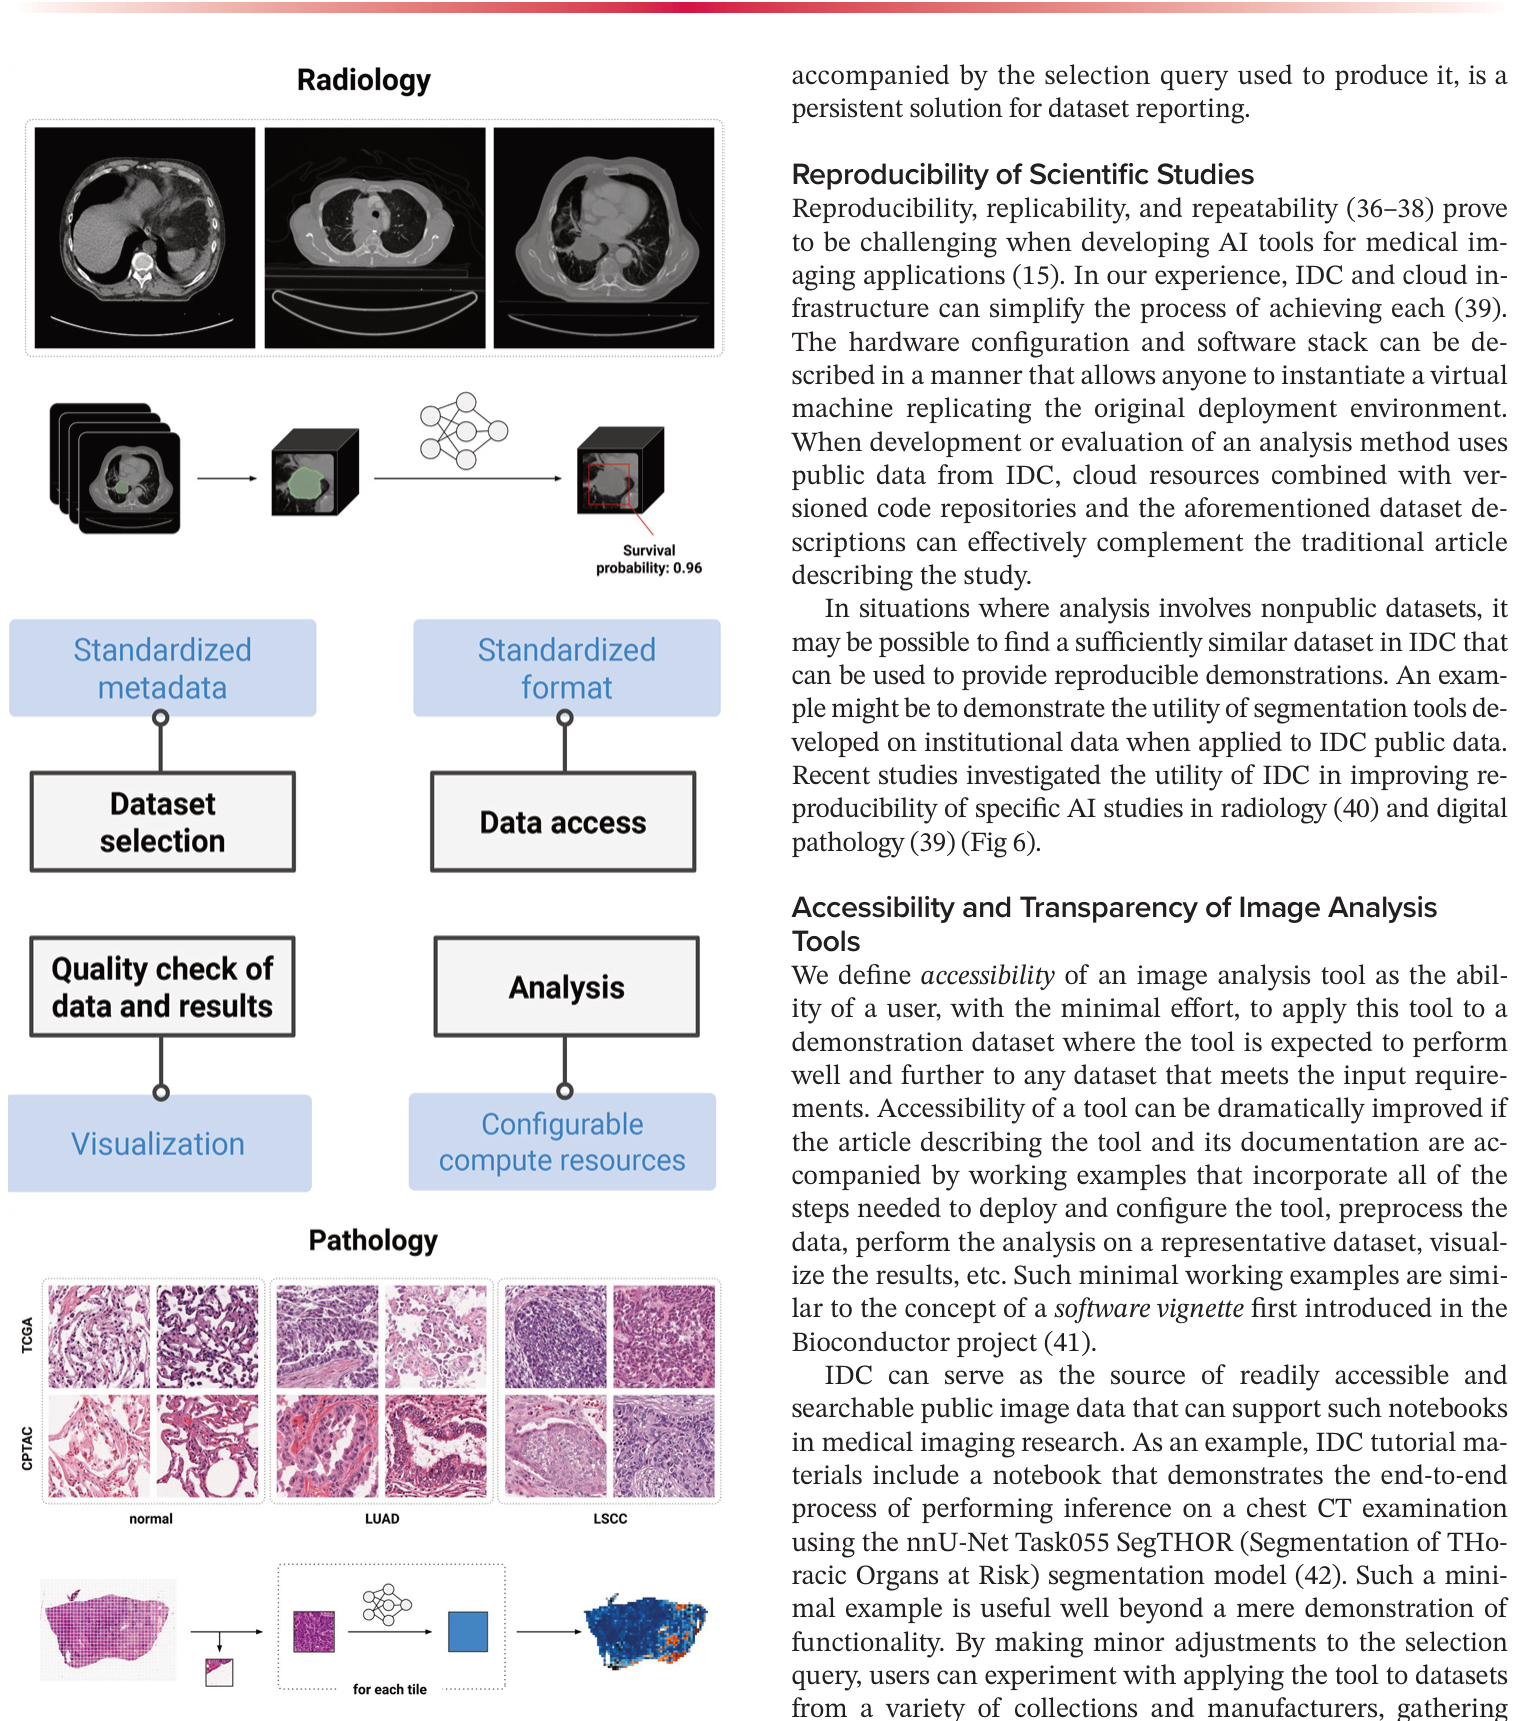
Figure 6. Figure 6. Highlights of IDC features and their contribution to the develop- ment of reproducible pipelines. To date, two reproducible analysis studies have been conducted by the IDC team: automated prognosis of lung cancer mortality based on standard-of-care CT (40) and automated classification of lung cancer histopathologic images (39). Both are accompanied by note- books allowing for reproduction if the study is using the cloud-provisioned compute resources and data available at IDC. LSCC = lung squamous cell carcinoma, LUAD = lung adenocarcinoma.解説: IDCの機能と、再現可能なパイプラインの開発への貢献のハイライトです。これまでに、IDCチームによって2つの再現可能な分析研究が実施されています。それは、標準的なCTに基づく肺がん死亡率の自動予測と、肺がんの病理組織画像の自動分類です。両研究には、クラウドプロビジョニングされた計算リソースとIDCで利用可能なデータを使用することで研究を再現できるノートブックが付属しています。
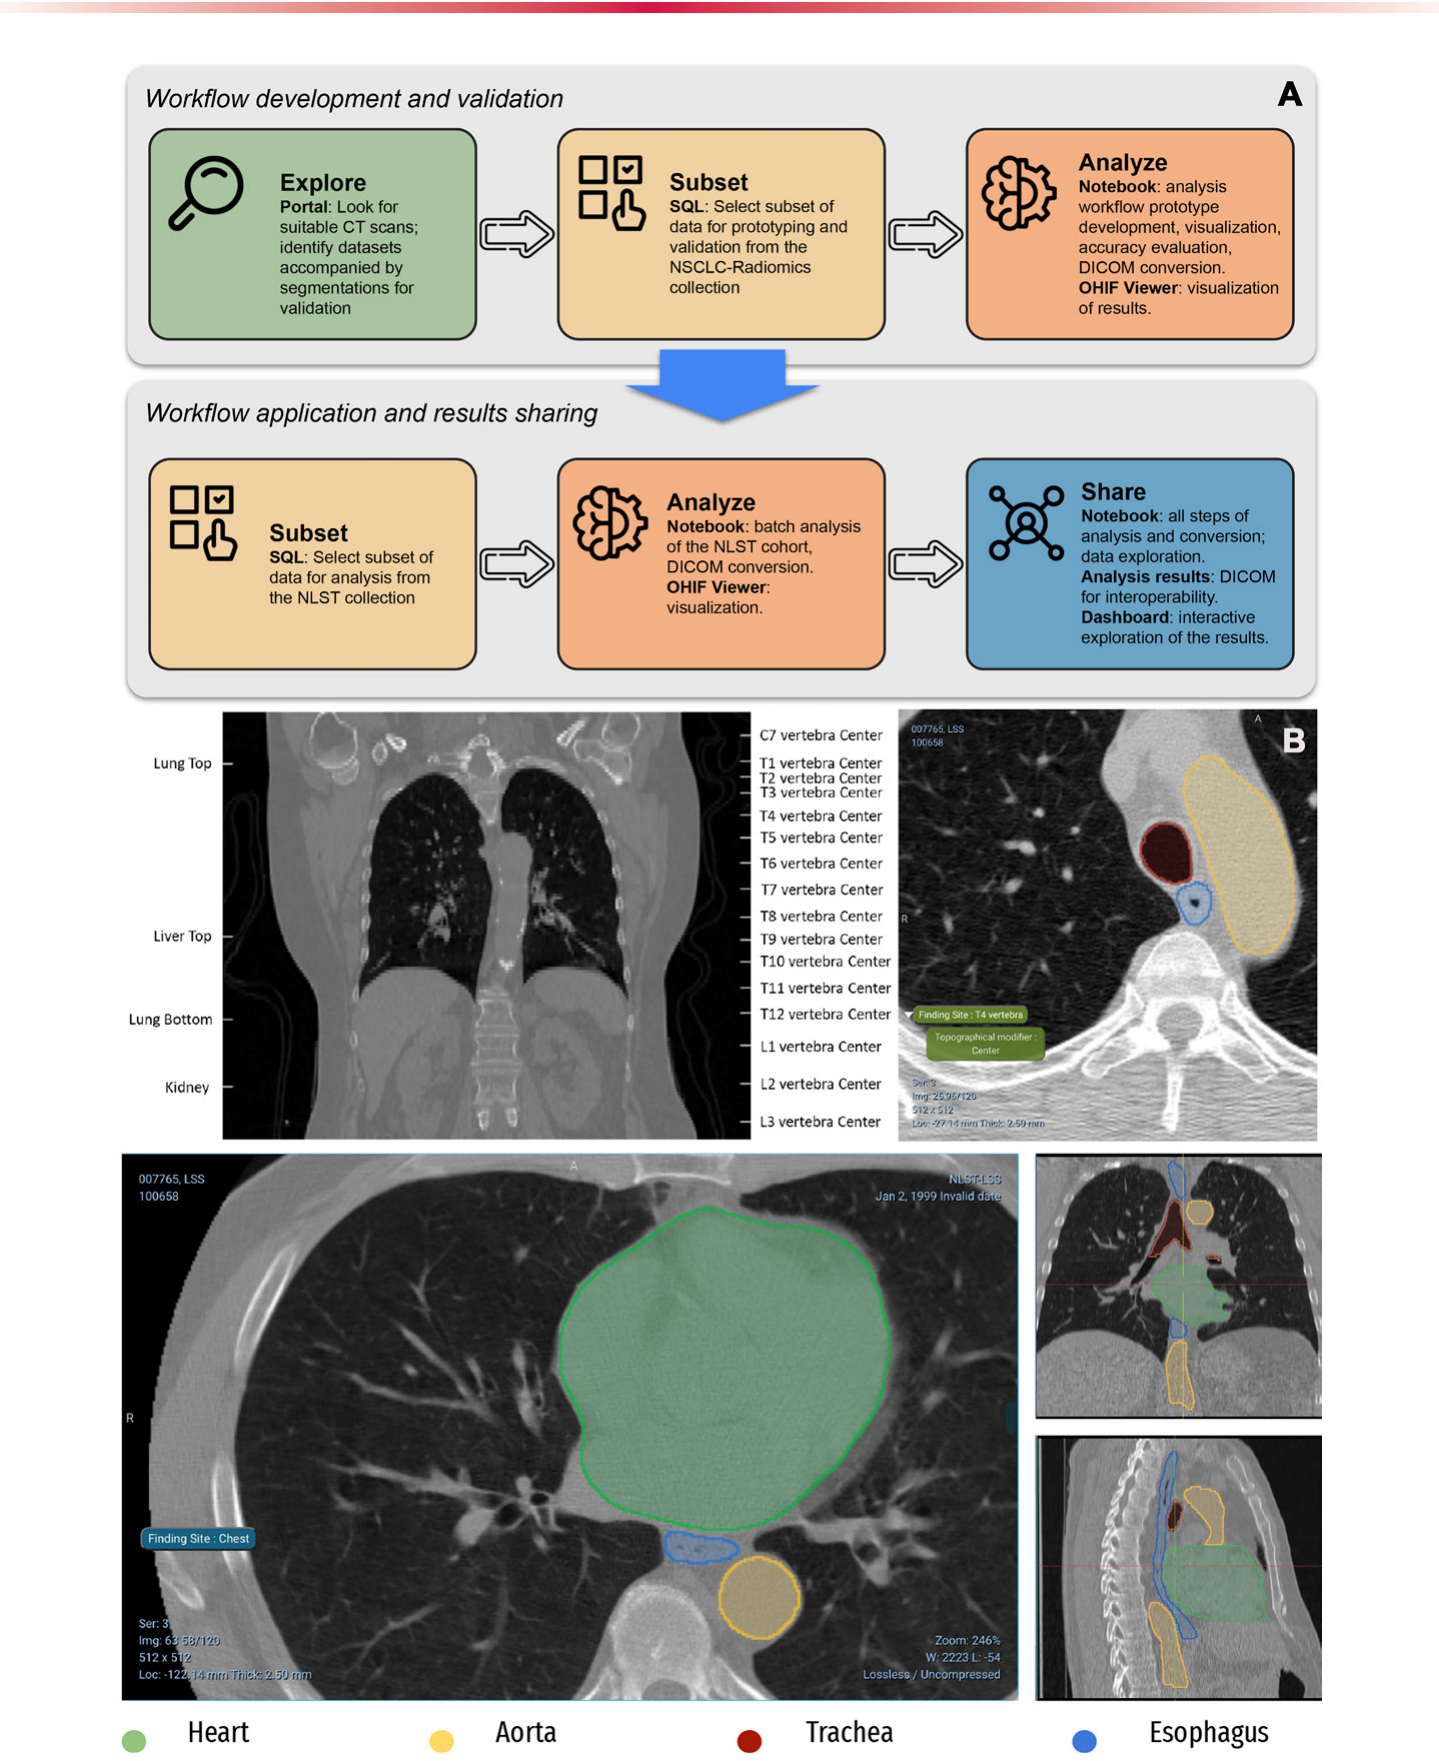
Figure 7. Figure 7. AI-generated annotations of CT images using BodyPartRegression (43) and the nnU-Net Task055 SegTHOR seg- mentation model (42), with further details on the application of these algorithms to the NSCLC-Radiomics and NLST collec- tions of IDC discussed by Krishnaswamy et al (23). (A) Top panel of the flowchart shows the process of development and in- teraction with the individual components of IDC. The bottom panel of the flowchart shows products generated in the process of analysis. (B) Top CT images containing anatomic landmarks corresponding to the centers of vertebra and several other structures (top left) are identified and labeled automatically (top right). Bottom CT images show volumetric segmentations of the pixels corresponding to the heart, esophagus, aorta, and trachea.解説: BodyPartRegressionとnnU-Net Task055 SegTHORセグメンテーションモデルを使用してAIによって生成されたCT画像のアノテーションです。これらのアルゴリズムのIDCのNSCLC-RadiomicsおよびNLSTコレクションへの適用に関する詳細は、Krishnaswamyらによって議論されています。(A) フローチャートの上部パネルは、IDCの個々のコンポーネメントを用いた開発と相互作用のプロセスを示します。フローチャートの下部パネルは、分析プロセスで生成される成果物を示します。(B) 上部のCT画像には、脊椎の中心や他のいくつかの構造に対応する解剖学的ランドマークが含まれており(左上)、自動的に識別されラベル付けされます(右上)。下部のCT画像には、心臓、食道、大動脈、気管に対応するピクセルの体積セグメンテーションが示されています。
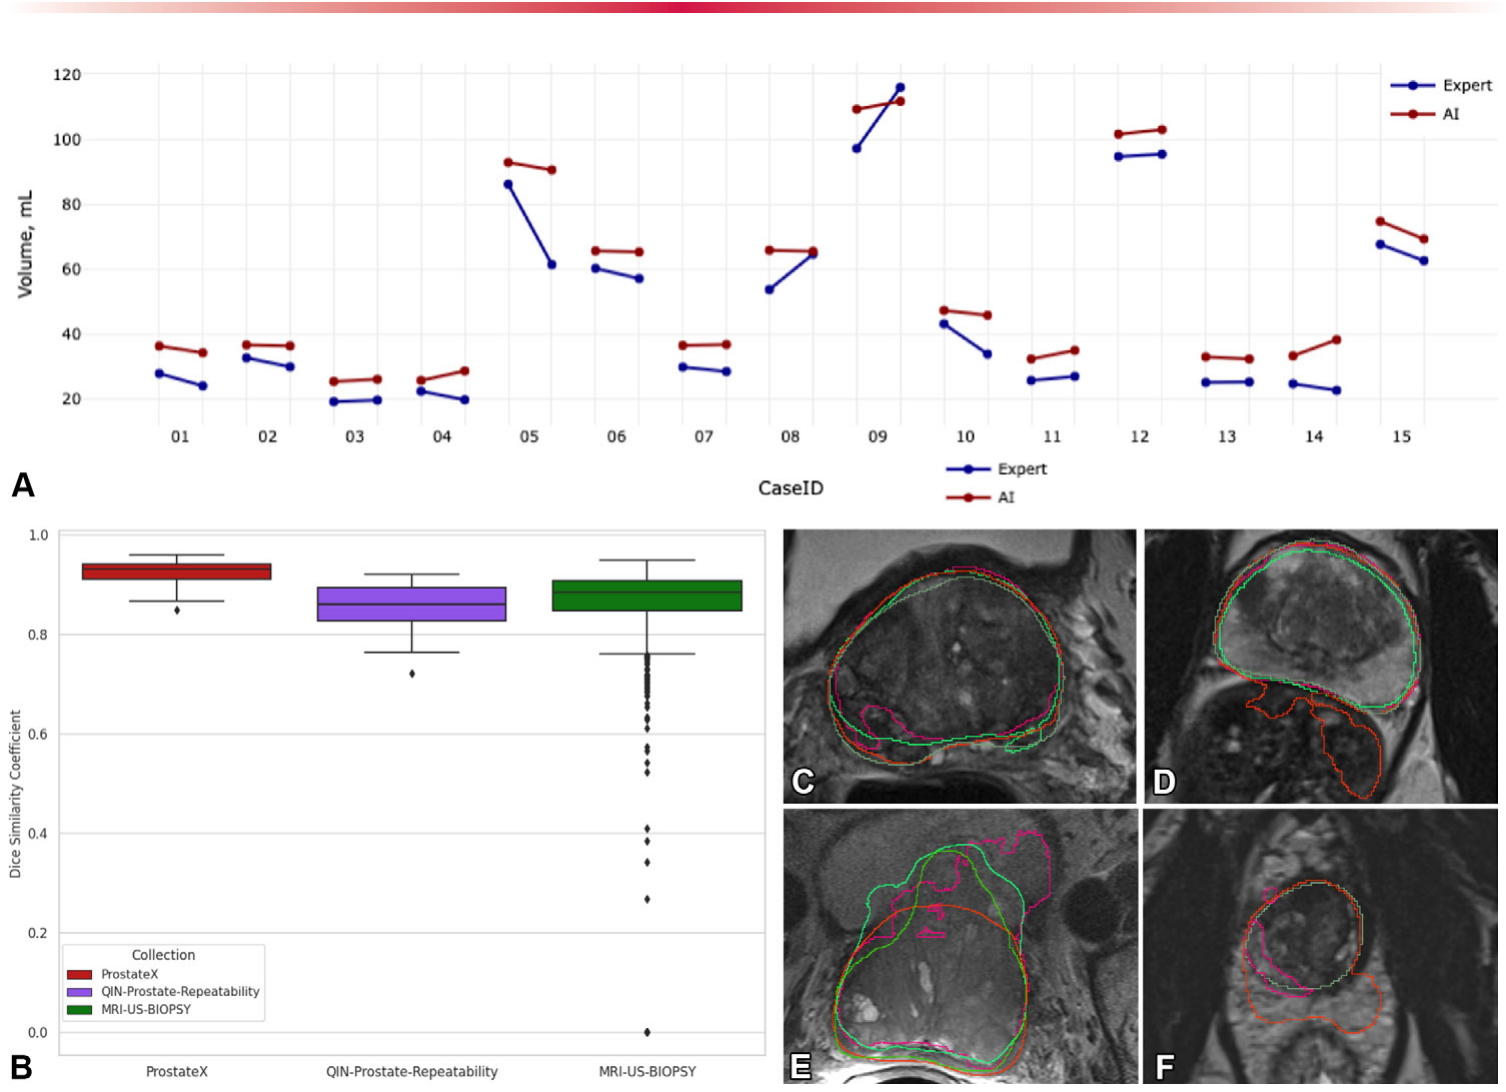
Figure 8. Figure 8. Highlights of an ongoing study evaluating the nnU-Net (42) and Prostate158 (47) algorithms applied to the prostate gland segmentation task. (A) Graph shows a comparison of the prostate gland volume calculated from the segmentation produced by AI (red) and the expert (blue) on the QIN-Pros- tate-Repeatability collection (50) available in IDC. Two measurements corresponding to the same case identification number were derived from the segmentations obtained from the two imaging studies obtained within 2 weeks, precluding biologic changes in the anatomy. Prostate volume is in most cases overestimated by AI as compared with the expert segmentations. (B) Dice similarity coefficient (DSC) graph shows that the distributions are visually different across the PROSTATEx, QIN-Prostate-Repeatability, and MRI-US-Biopsy collections of IDC. (C–F) Sample MR images from the PROSTATEx (C, D), QIN-Prostate-Repeatability (E), and MRI-US-Biopsy (F) collections show segmentation results produced by different AI algorithms and the manual outlines of the prostate (dark green).解説: 前立腺セグメンテーションタスクに適用されたnnU-NetとProstate158アルゴリズムを評価する進行中の研究のハイライトです。(A) IDCで利用可能なQIN-Prostate-Repeatabilityコレクションのデータに基づき、AI(赤)と専門家(青)が生成したセグメンテーションから計算された前立腺体積の比較グラフです。同じ症例IDに対応する2つの測定値は、2週間以内に取得された2つの画像研究から導出されており、解剖学的な生物学的変化を除外しています。前立腺体積はほとんどの場合、専門家のセグメンテーションと比較してAIによって過大評価されています。(B) ダイス類似度係数(DSC)グラフは、PROSTATEx、QIN-Prostate-Repeatability、MRI-US-BiopsyのIDCコレクション間で分布が視覚的に異なることを示しています。(C–F) PROSTATEx (C, D)、QIN-Prostate-Repeatability (E)、MRI-US-Biopsy (F) コレクションからのMR画像サンプルは、異なるAIアルゴリズムによって生成されたセグメンテーション結果と前立腺の手動輪郭(濃い緑色)を示しています。
大規模な生体医用データの分析: 生体医用画像データの大規模な分析は、個々の画像とコホート全体の膨大なサイズ、および現代のAIツールが課すGPUハードウェア要件のために、重大な計算上の課題を提起します。クラウドベースのソリューションは、オンデマンドでスケーラブルな計算リソースを提供し、「使用した分だけ支払う」モデルによりコスト削減の可能性を秘めています。CRDC内では、Broad Institute FireCloudとSeven Bridges Cancer Genomics Cloudプラットフォームが、クラウドベンダーが提供する機能セットを補完する追加サービスを提供し、クラウドの利用を簡素化します。初期の研究結果では、これらの上位レベルプラットフォームを使用することで、大規模な画像コホートに対して処理時間という点で目覚ましい利点が得られることが示されています。
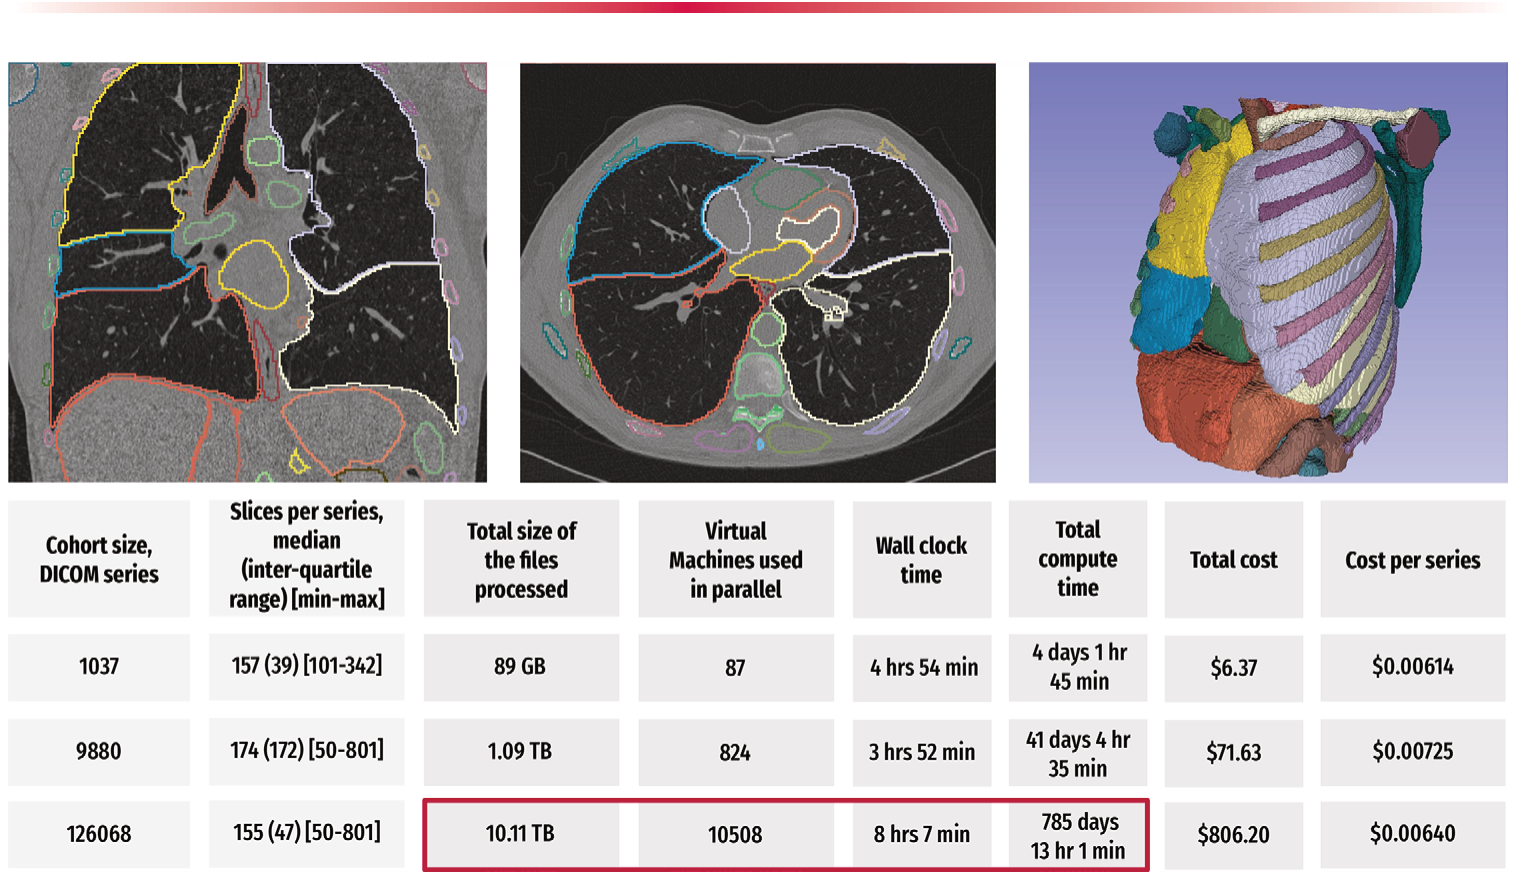
Figure 9. Figure 9. Summary of the results of a preliminary study evaluating the time- and cost-efficient scalable application of the TotalSegmentator algorithm (58) to the IDC NLST collection using CRDC resources. For each of the analyzed cases in the three cohorts of sizes 1037, 9880, and 126 068 in a CT series, the algorithm was used to segment up to 104 anatomic structures (depending on the coverage of the anatomy in a given imaging examination), followed by the extraction of the shape and first-order radiomics features for each of the segmented regions using the pyradiomics library (59). Coronal and axial CT images (top left and center, respectively) and a surface rendering of the segmentations generated using 3D Slicer (https://slicer.org) software (top left) show sample visualizations of the analysis (60). Bottom table summarizes the key parameters and observed performance of the two experiments. The total compute time corresponds to the time needed to perform computation sequentially. In the case of the 126 068 series analysis (red box), scaling of the processing to use 10 508 cloud-based virtual machines in parallel reduced the processing time from the estimated more than 785 days by using a single virtual machine to about 8 hours. The costs are expected to be even lower for the researchers eligible to access the discounts provided by the National Institutes of Health Sci- ence and Technology Research Infrastructure for Discovery, Experimentation, and Sustainability (STRIDES) Initiative.解説: CRDCリソースを使用してIDC NLSTコレクションにTotalSegmentatorアルゴリズムを時間的・費用効率的にスケーラブルに適用する予備研究の結果概要です。3つのコホート(サイズ1037、9880、126,068)のCTシリーズで分析された各ケースについて、アルゴリズムは最大104の解剖学的構造をセグメント化するために使用され、その後、pyradiomicsライブラリを使用して各セグメント化された領域の形状と一次ラジオミクス特徴が抽出されました。冠状面および軸状CT画像(それぞれ左上と中央)と、3D Slicerソフトウェアを使用して生成されたセグメンテーションの表面レンダリング(右上)は、分析のサンプル可視化を示しています。下部の表は、2つの実験の主要なパラメータと観測されたパフォーマンスをまとめたものです。総計算時間は、計算をシーケンシャルに実行するために必要な時間に対応します。126,068シリーズの分析(赤枠)の場合、10,508台のクラウドベースの仮想マシンを並列使用することで、処理時間が単一の仮想マシンを使用した場合の推定785日以上から約8時間に短縮されました。米国国立衛生研究所のSTRIDESイニシアチブによる割引の対象となる研究者にとっては、コストはさらに低くなると予想されます。
今後の展望と課題
NCI CRDCは、がんデータエコシステム内でのデータキュレーション、管理、共同分析に対する包括的なアプローチを実装することを目指しています。IDCは、データアーカイブとしての機能を超え、がん画像研究におけるこれら全ての活動をサポートすることを意図したCRDC内のコンポーネントとして常に考慮されるべきです。IDCの画像と画像由来データを統一されたDICOM表現に調和させるための献身的な努力、およびそのような調和と結果データの使用を可能にするサポートツールの開発は、既存のリポジトリ(TCIAやMedical Imaging and Data Resource Center(MIDRC)など)とは一線を画しています。
IDCプロジェクト内では、既知および将来の課題に対処するための多数の進行中の方向性があります。そのような課題の一つは、医療画像データ分析タスクのために大規模なクラウドコンピューティングリソースを利用するコミュニティ内の経験不足です。IDCデータ摂取とキュレーションは、提出者によって実装された匿名化手順のレビュー、付随するメタデータの収集、提出されたデータの標準DICOM表現への変換に現在、かなりのリソースを必要とします。これらのタスクの一部は、CRDCデータ提出者をサポートするための専用リソースであるCRDC Data Hubによってサポートされることが期待されています。現在のところ、IDCは制限なしで利用可能なコレクションのみをホストすることに限定されていますが、優先順位とリソースの利用可能性に応じて、データ隔離またはデータ公開の時間制限に対応するために、限定アクセスコレクションのサポートを追加することを検討しています。

コメントを残す