どうも、Beyond the Pixelです。医療現場では、日々膨大な数の医用画像が撮影され、専門家がその画像を詳細に解析し、テキスト形式のレポートを作成しています。このプロセスは、疾患の診断や治療方針の決定に不可欠ですが、画像診断数の増加に伴い、専門家にかかる負担は増大する一方です。このような課題に対し、人工知能(AI)の一種である深層学習モデルが、画像とテキストを結びつける新たな技術として注目されています。この技術は、画像診断ワークフローの効率化、診断精度向上、そして将来的には新しい教育ツールの創出に貢献する可能性を秘めています。本記事では、医用画像とテキストを結びつける深層学習モデルの基礎知識と、その臨床応用について詳しく解説します。これらのモデルは、データ埋め込み、自己教師あり学習、ゼロショット学習、トランスフォーマーベースのモデルアーキテクチャといった技術の進歩によって実現しました。これにより、医療画像の自動キャプション生成、放射線レポートのドラフト作成、教育用画像の生成といった多様な応用が期待されています。これらの進歩は、症例の優先順位付け、臨床ワークフローの合理化、診断精度の向上を可能にするかもしれません。
画像とテキストを結びつける深層学習モデルのカテゴリ
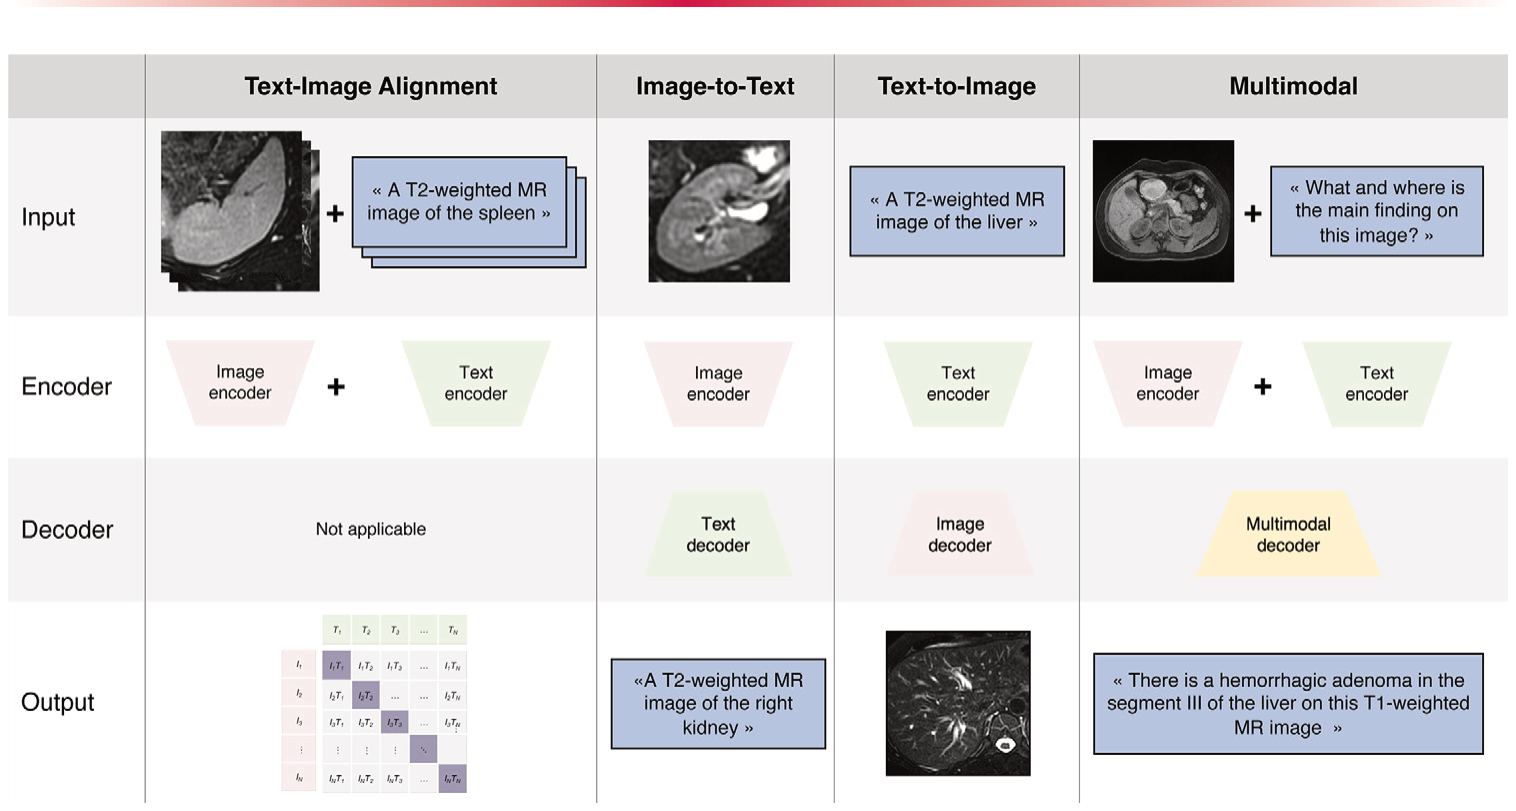
深層学習モデルは、その入出力に基づいて主に4つのカテゴリに分類できます。
Figure 2. Figure 2. Summary of the four categories of deep learning models connecting text and images. These models are text-image alignment, text-to-im- age, image-to-text, and multimodal models. The input, encoder, decoder, and output for each model are illustrated. For text-image alignment, images and text are input into their respective encoders to produce an embedding for both images and text, with scores indicating their similarity (eg, how well they are aligned). In an image-to-text model, an image is fed into an image encoder, which produces features that are subsequently fed into a text decoder to generate text descriptions as output. In a text-to-image model, text descriptions are fed into a text encoder, which generates features that are subsequently fed into an image decoder to produce images as output. In a multimodal model, both images and text are fed into their respective encoders, are combined and processed through a joint embedding by a multimodal decoder, and produce integrated outputs such as text.解説: この図は、テキストと画像を接続する深層学習モデルの4つのカテゴリ(テキスト-画像アラインメント、テキスト-画像、画像-テキスト、マルチモーダルモデル)をまとめています。それぞれのモデルの入力、エンコーダ、デコーダ、出力が図解されています。
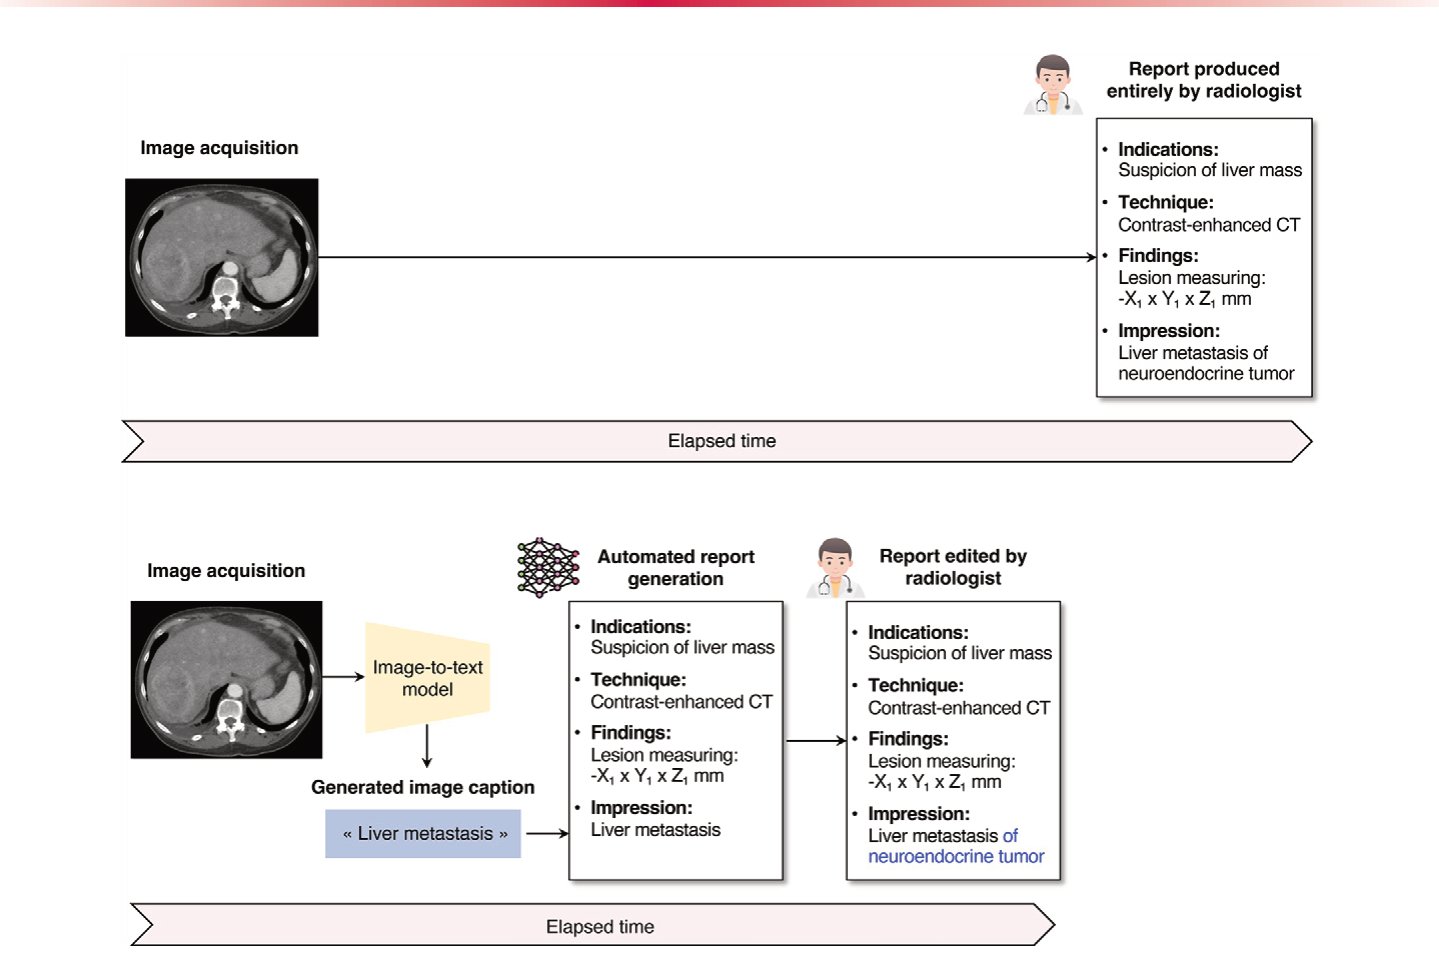
Figure 1. Figure 1. Illustration shows the concept of automated report generation with image-to-text models. The cur- rent interpretation workflow relies on the production of reports by radiologists. Image-to-text models may assist radiologists by analyzing the medical images and automatically populating sections of radiology reports in the background. The radiologist then interprets the images and edits the generated reports to produce a final report. If an AI-augmented workflow becomes efficient, it has the potential to save interpretation time compared with that of the existing workflow. (Icons made by Freepik, Amethyst Design from www.flaticon.com.)解説: この図は、画像-テキストモデルを用いた放射線レポート自動生成の概念を示しています。現在のワークフローでは専門家がレポートを作成しますが、画像-テキストモデルは医用画像を分析し、放射線レポートのセクションを自動で入力することで、専門家を支援する可能性があります。
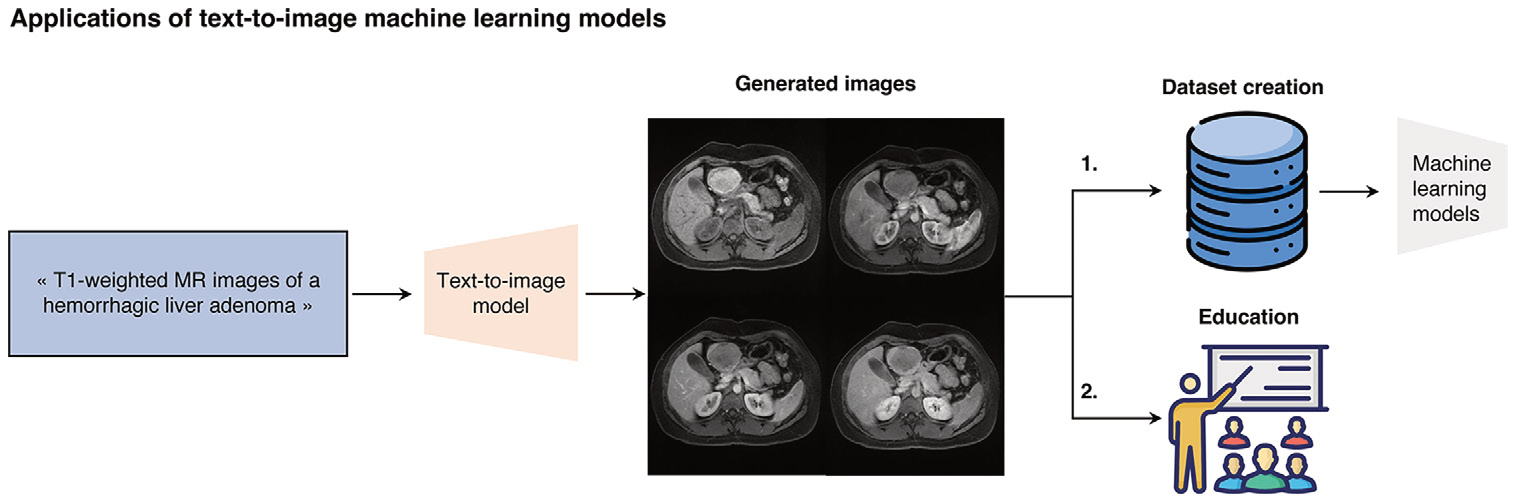
Figure 3. Figure 3. Illustration shows the leveraging challenges associated with the lack of domain-specific datasets and educational barriers in radiol- ogy with text-to-image models. Text-to-image models can augment existing radiologic datasets by generating image variations based on text de- scriptions. This approach could be useful when the datasets are small, as it provides additional data for training of AI models, reducing the time and cost to create large medical imaging datasets. These models could also be used to enhance training and education in radiology. Trainees could learn to associate text findings with corresponding radiologic images. (Icons made by Freepik, VectorPortal from www.flaticon.com.)解説: この図は、テキスト-画像モデルが放射線学におけるドメイン固有データセットの不足や教育上の課題を克服するために活用される可能性を示しています。テキスト記述に基づいて画像バリエーションを生成することで、既存の放射線データセットを増強できます。
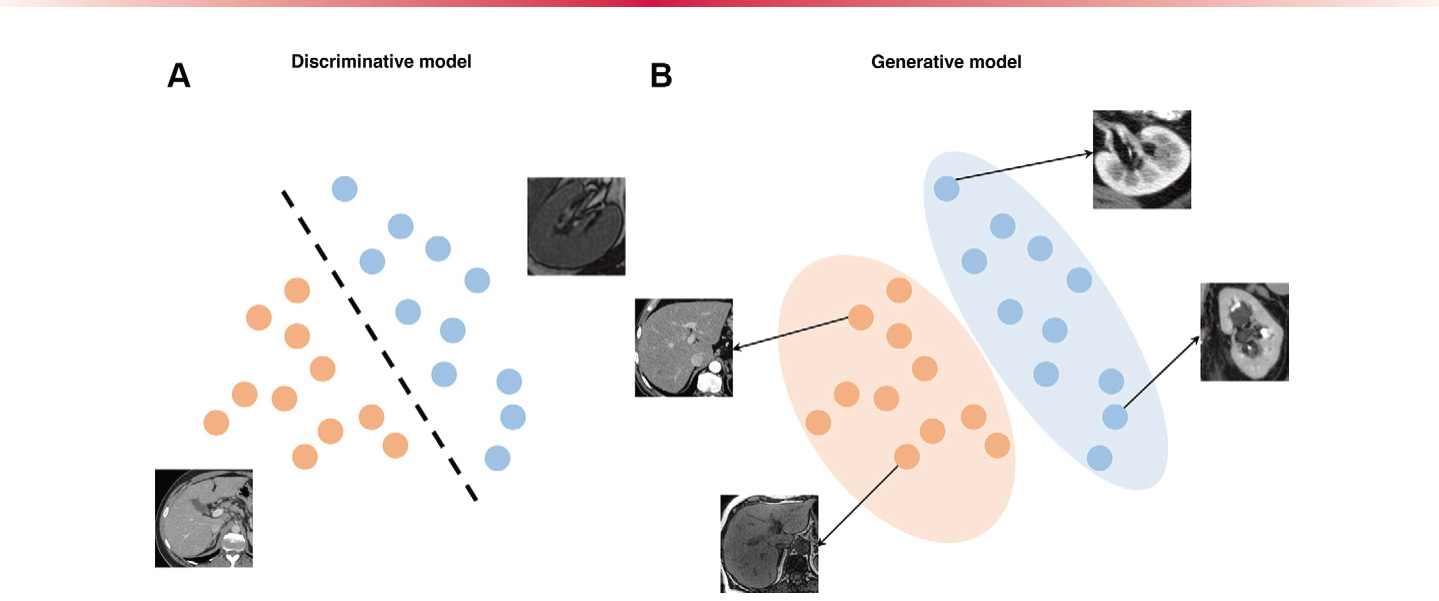
Figure 4. Figure 4. Illustrations show the differences between discriminative and generative models. (A) Discrimina- tive models learn the decision boundary (represented by the dotted line) separating different classes in the training data. In this example, a discriminative model aims to find the optimal line that best separates the two classes (liver and kidney). The goal is to accurately classify new data points (ie, discriminative classifi- cation) by determining on which side of the boundary they fall, based on learned features (eg, to determine whether a new image contains a liver or a kidney). (B) Generative models learn the underlying patterns of the training data and generate similar new data. In this example, darker-colored small circles represent individ- ual training examples of the liver (in beige) and the kidneys (in blue). The lighter-colored ellipses represent their respective distribution. The images in boxes illustrate the concept of synthetic (ie, generated) images.解説: この図は、識別モデルと生成モデルの違いを示しています。(A) 識別モデルは、入力データ内の異なるクラスを分離する決定境界線(点線)を学習します。(B) 生成モデルは、訓練データの根底にあるパターンを学習し、元の訓練データに似た新しいサンプルを生成します。
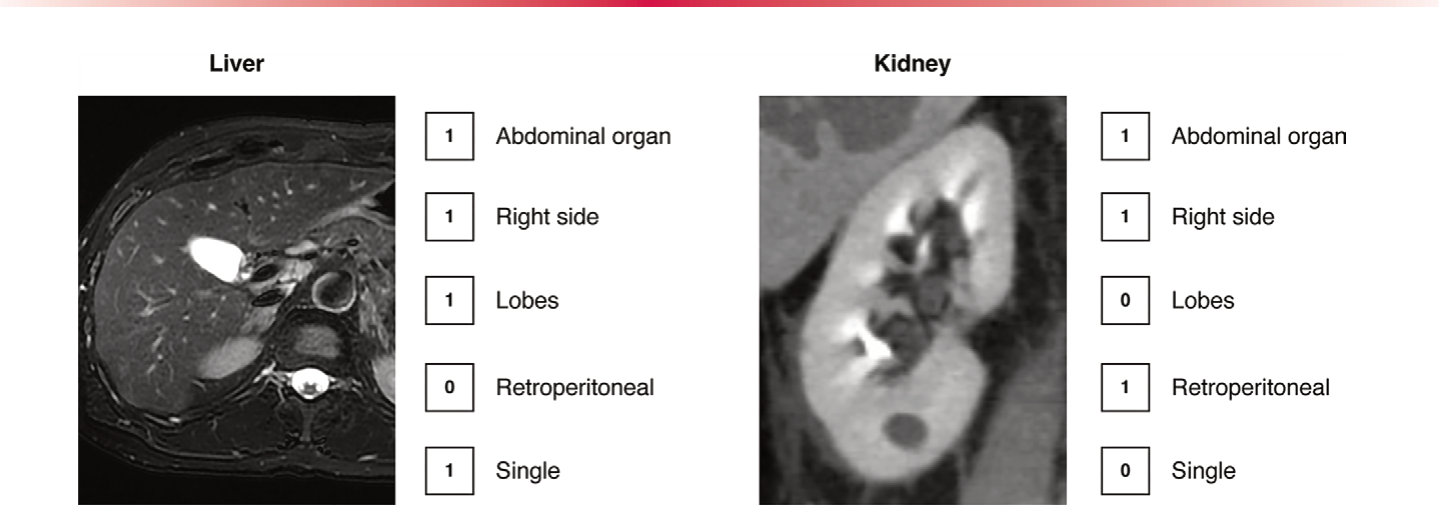
Figure 9. Figure 9. Illustration of semantic embedding. Semantic embedding is a way to represent data (ie, images or words) that captures their meaning. A special set of numerical values is assigned to each example based on its features and relation- ships with other examples. Examples that have similar characteristics have similar numbers, and examples with different characteristics have different numbers. For instance, both the liver and the kidney shown are right-sided organs (value of 1 for each image), but they differ in their localization (ie, retroperitoneal; divergent values of 1 and 0). By using semantic em- bedding, models can compare and analyze the content of different examples, even if they have never seen those specific examples before. This is typically achieved through deep learning techniques, where neural networks are trained on large datasets to learn to extract meaningful features that are then transformed into vectors that capture the information in a compact representation (33).解説: この図は、意味的埋め込みの概念を示しています。意味的埋め込みは、データ(画像や単語)の意味を捉える表現方法です。各例には、その特徴と他の例との関係に基づいて特殊な数値が割り当てられます。例えば、肝臓と腎臓はどちらも腹部の臓器ですが、局在(後腹膜かどうか)が異なります。
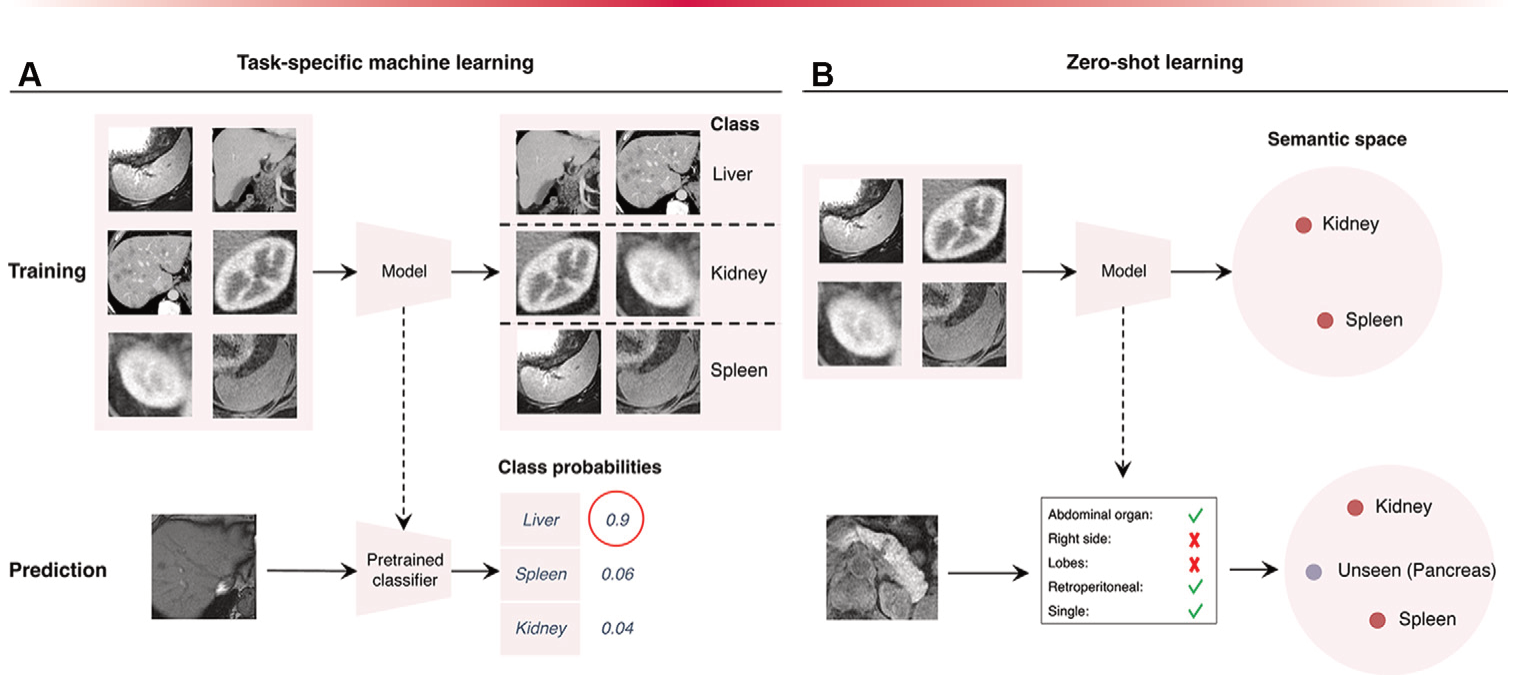
Figure 7. Figure 7. Illustrations show differences between task-specific machine learning and zero-shot learning. (A) Task-specific machine learning requires a large, labeled training dataset with all relevant classes to accurately classify new examples during prediction. For accurate prediction, the input image during the prediction phase must be a variation of the classes seen during training, such as different images of the liver in this case. (B) Zero-shot learning overcomes the need for labeled examples of unseen classes by enabling the model to generalize from what it has al- ready learned. In this example, the model is trained on a dataset with various radiologic images. During the prediction phase, when it encounters an unseen image (eg, one of the pancreas), the model classifies it based on prior knowledge. It does not specifically recognize or label the image as “pancreas”; instead, it identifies that the image does not match any of the known classes (eg, liver or kidney). Essentially, it performs outlier detection, and it is up to the user to determine that the outlier is the pancreas (33).解説: この図は、タスク固有の機械学習とゼロショット学習の違いを示しています。(A) タスク固有の機械学習は、予測時に新しい例を正確に分類するために、すべての関連クラスがラベル付けされた大規模な訓練データセットを必要とします。(B) ゼロショット学習は、モデルがすでに学習したことから汎化することを可能にすることで、未知のクラスのラベル付き例の必要性を克服します。
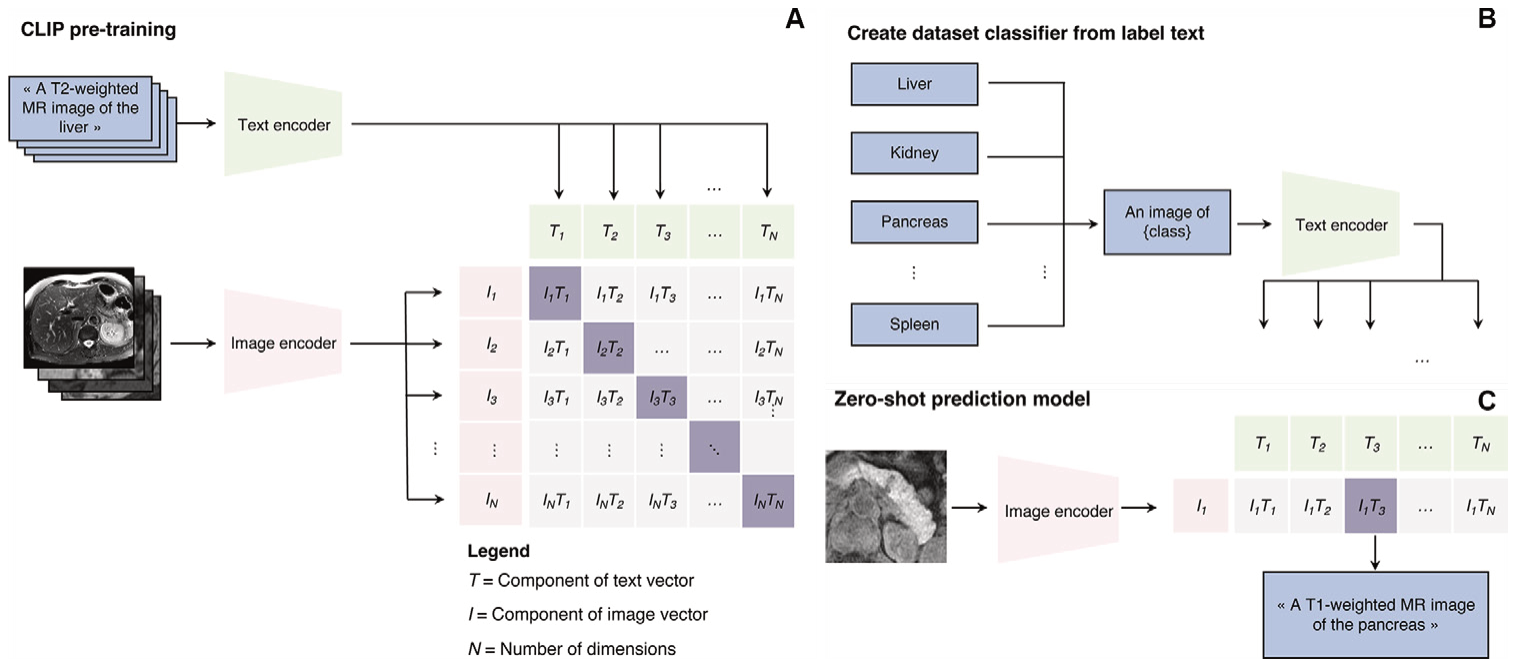
Figure 10. Figure 10. Illustrations show contrastive language-image pretraining (CLIP). CLIP is a text-image alignment model that pairs embeddings of text and images. (A) The architecture of CLIP features a text encoder and an image encoder that produce embeddings in a common space. The training process aligns embeddings of matching image-text pairs while separating those of nonmatching pairs. (B) After training, CLIP can classify images based on text descriptions. It converts class descriptions into embeddings with its text encoder and compares them to the image embeddings generated by its image encoder. The image is assigned to the class with the highest similarity score. (C) This setup gives CLIP ze- ro-shot capabilities, enabling it to classify images into new categories based only on textual descriptions. For example, to identify axial images of the pancreas, CLIP can use the class description “an axial image of the pancreas” even if it wasn’t specifically trained for that category (39).解説: この図は、対照言語-画像事前学習(CLIP)を示しています。CLIPはテキストと画像の埋め込みをペアリングするテキスト-画像アラインメントモデルです。(A) CLIPのアーキテクチャは、共通空間で埋め込みを生成するテキストエンコーダと画像エンコーダを特徴とします。訓練プロセスは、一致する画像-テキストペアの埋め込みを近づけ、一致しないペアを離すように調整されます。(B) 訓練後、CLIPはテキスト記述に基づいて画像を分類できます。(C) この設定により、CLIPはゼロショット能力を獲得し、テキスト記述のみに基づいて新しいカテゴリに画像を分類できます。
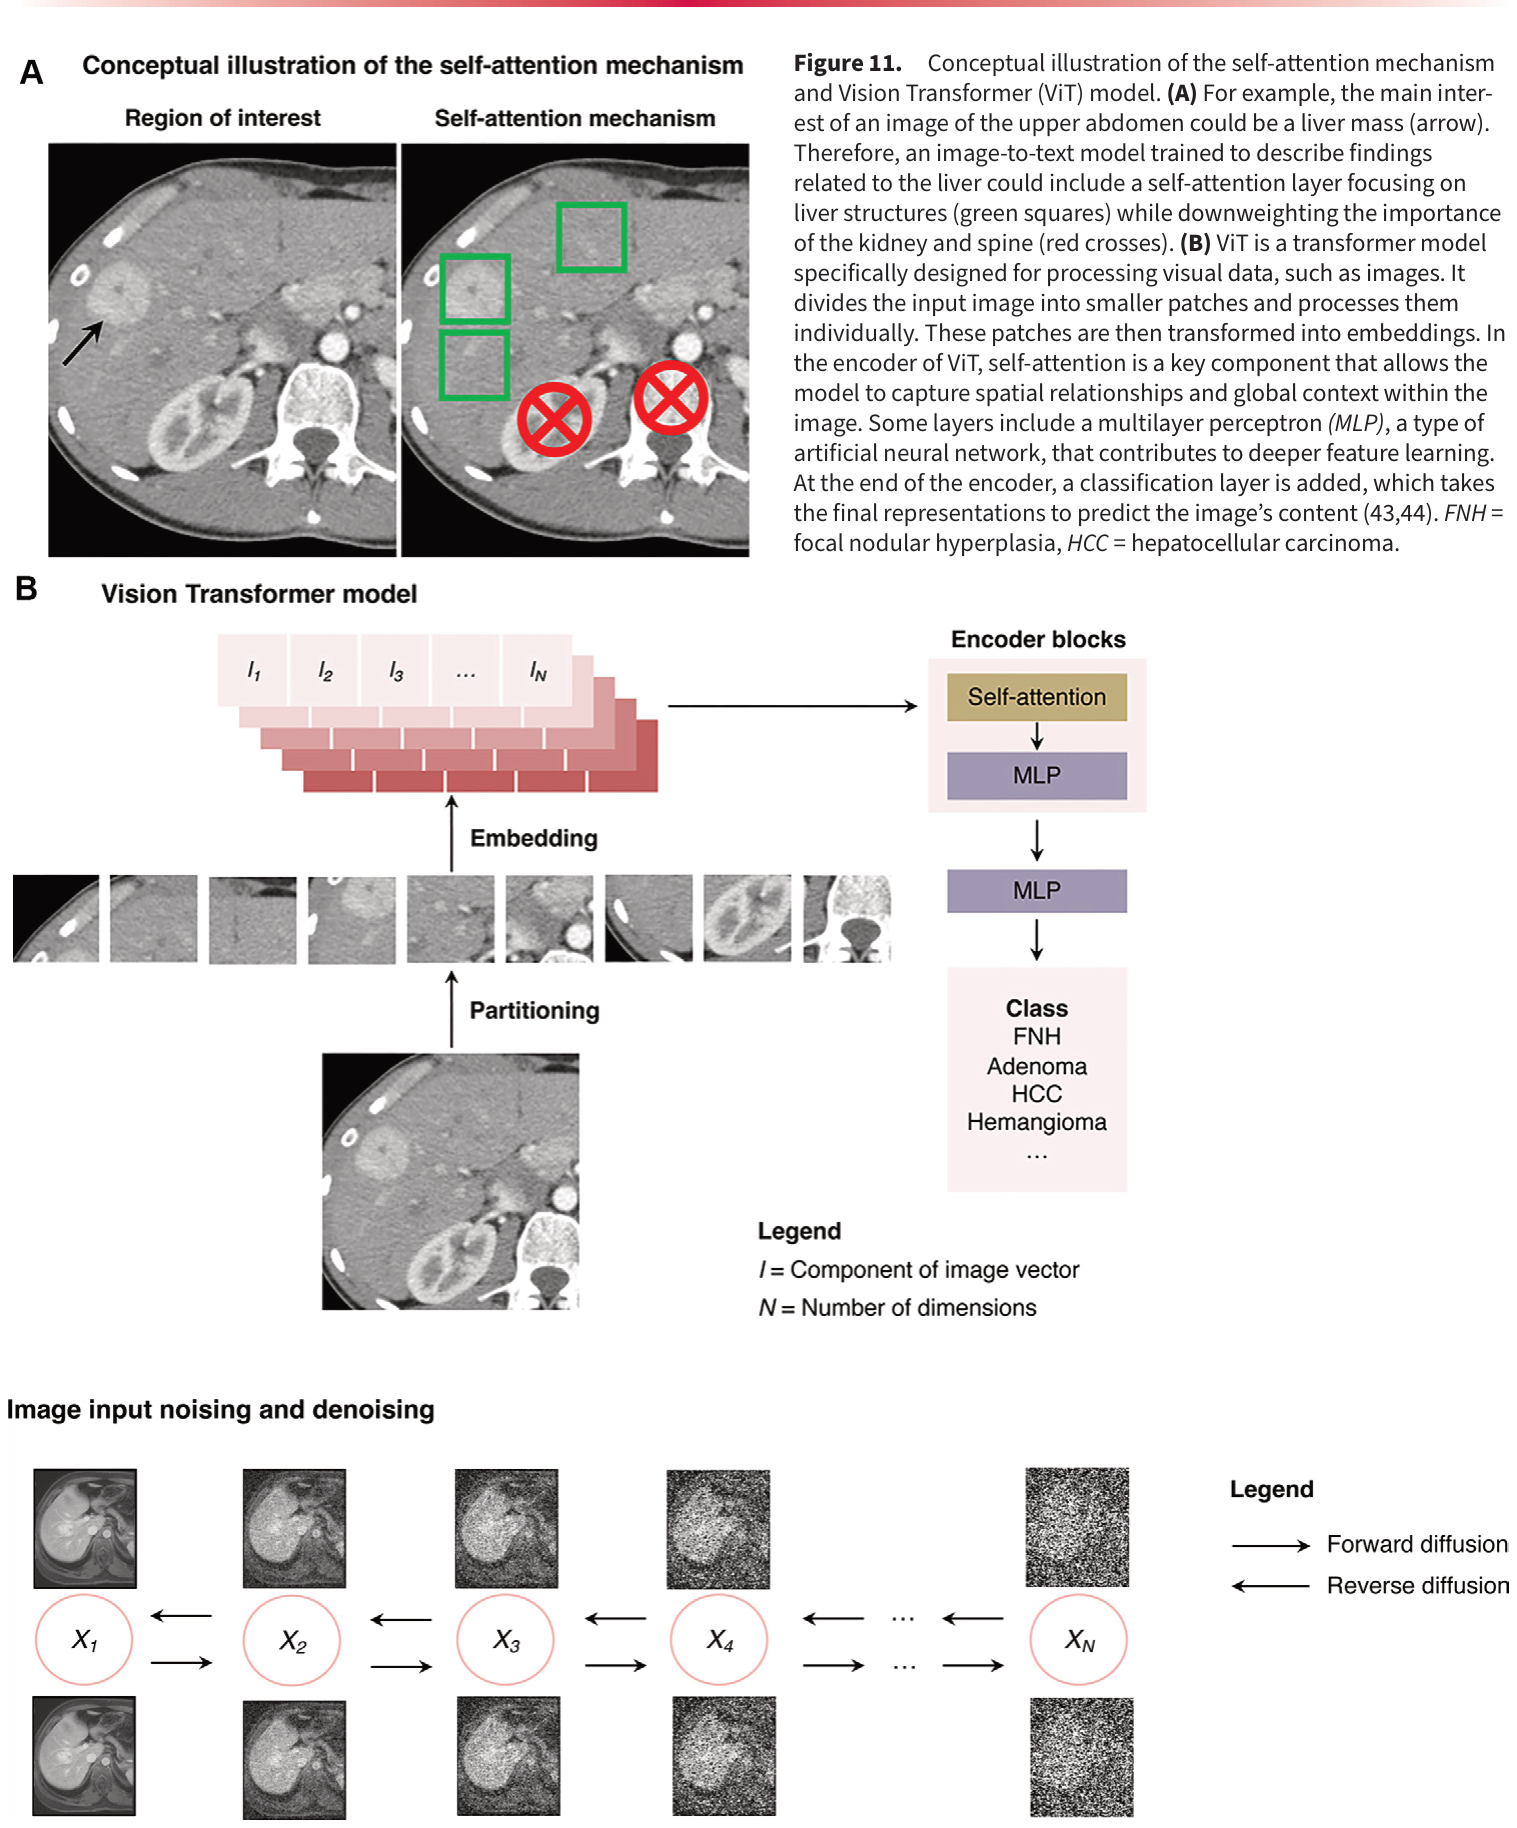
Figure 12. Figure 12. Illustration shows diffusion model architecture. The diffusion model is a type of generative model. It starts with a clear image and gradually adds noise until the image becomes unrecognizable through a forward diffusion process. It then learns to reverse this process by start- ing with the noisy image and progressively removing the noise to recreate a clear image through a reverse diffusion process. From a technical standpoint, the model generates a series (N) of increasingly noisy images by adding Gaussian (random) noise and then reverses this process to produce a series (N) of less noisy images, ultimately recovering the original image (54).解説: この図は、拡散モデルのアーキテクチャを示しています。拡散モデルは生成モデルの一種であり、クリアな画像に徐々にノイズを加えて認識できない画像にする「順拡散プロセス」から始まります。次に、ノイズの多い画像からノイズを段階的に除去してクリアな画像を再構築する「逆拡散プロセス」を学習します。
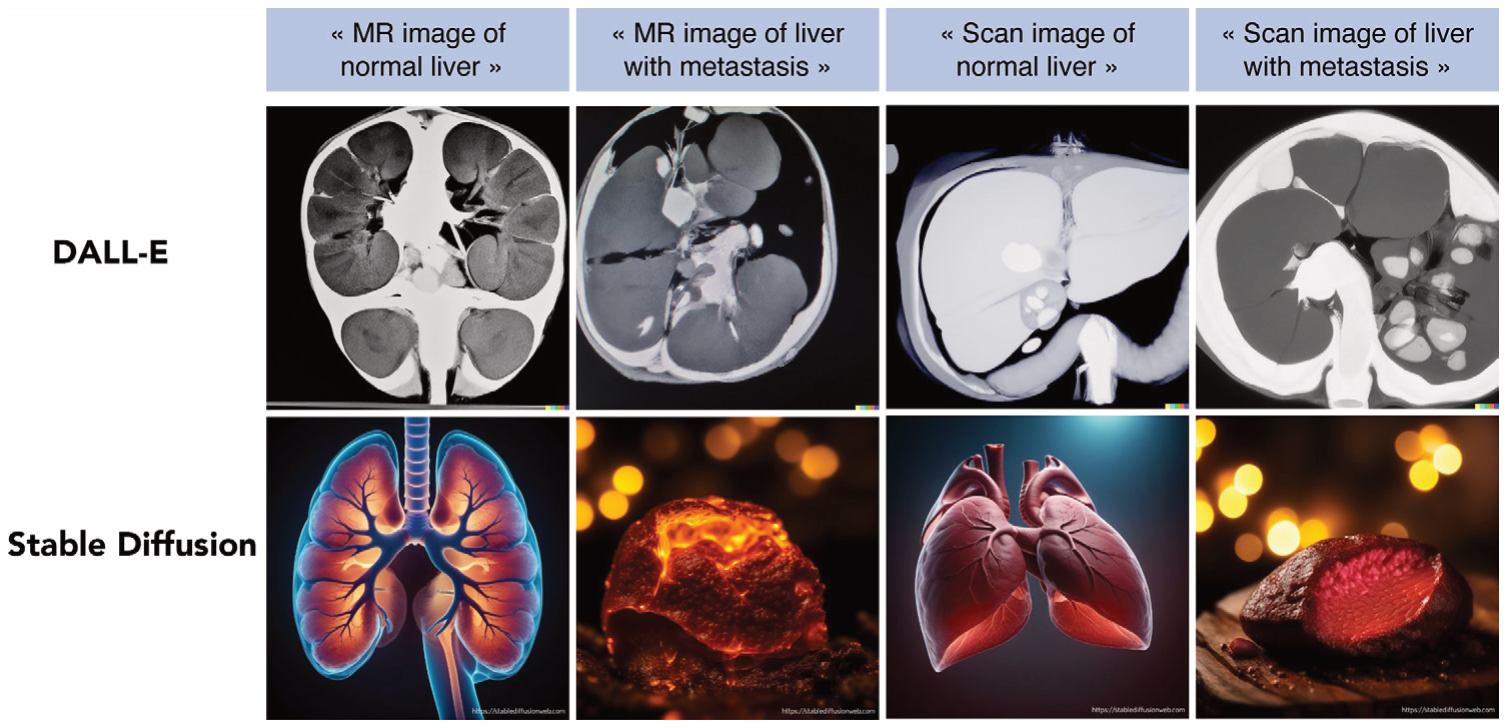
Figure 15. Figure 15. Examples of synthetic images generated by two text-to-image models, DALL-E 2 (top row) and Stable Diffusion (bottom row), given simple prompts related to medical imaging (50,51). Since these models are trained on large datasets of text and image pairs from the internet, they cannot generalize well to radiology because of the scarcity of openly available medical imaging data, hence the departure from anatomic reality. Future directions include the creation of annotated datasets combining radiology reports and medical images as well as training of these models on these datasets.解説: この図は、DALL-E 2(上段)とStable Diffusion(下段)という2つのテキスト-画像モデルによって生成された合成画像の例で、医用画像に関連するシンプルなプロンプトが与えられています。これらのモデルはインターネット上のテキストと画像ペアの大規模なデータセットで訓練されているため、オープンに利用可能な医用画像データが不足しているため、放射線学にはうまく汎化できていません。
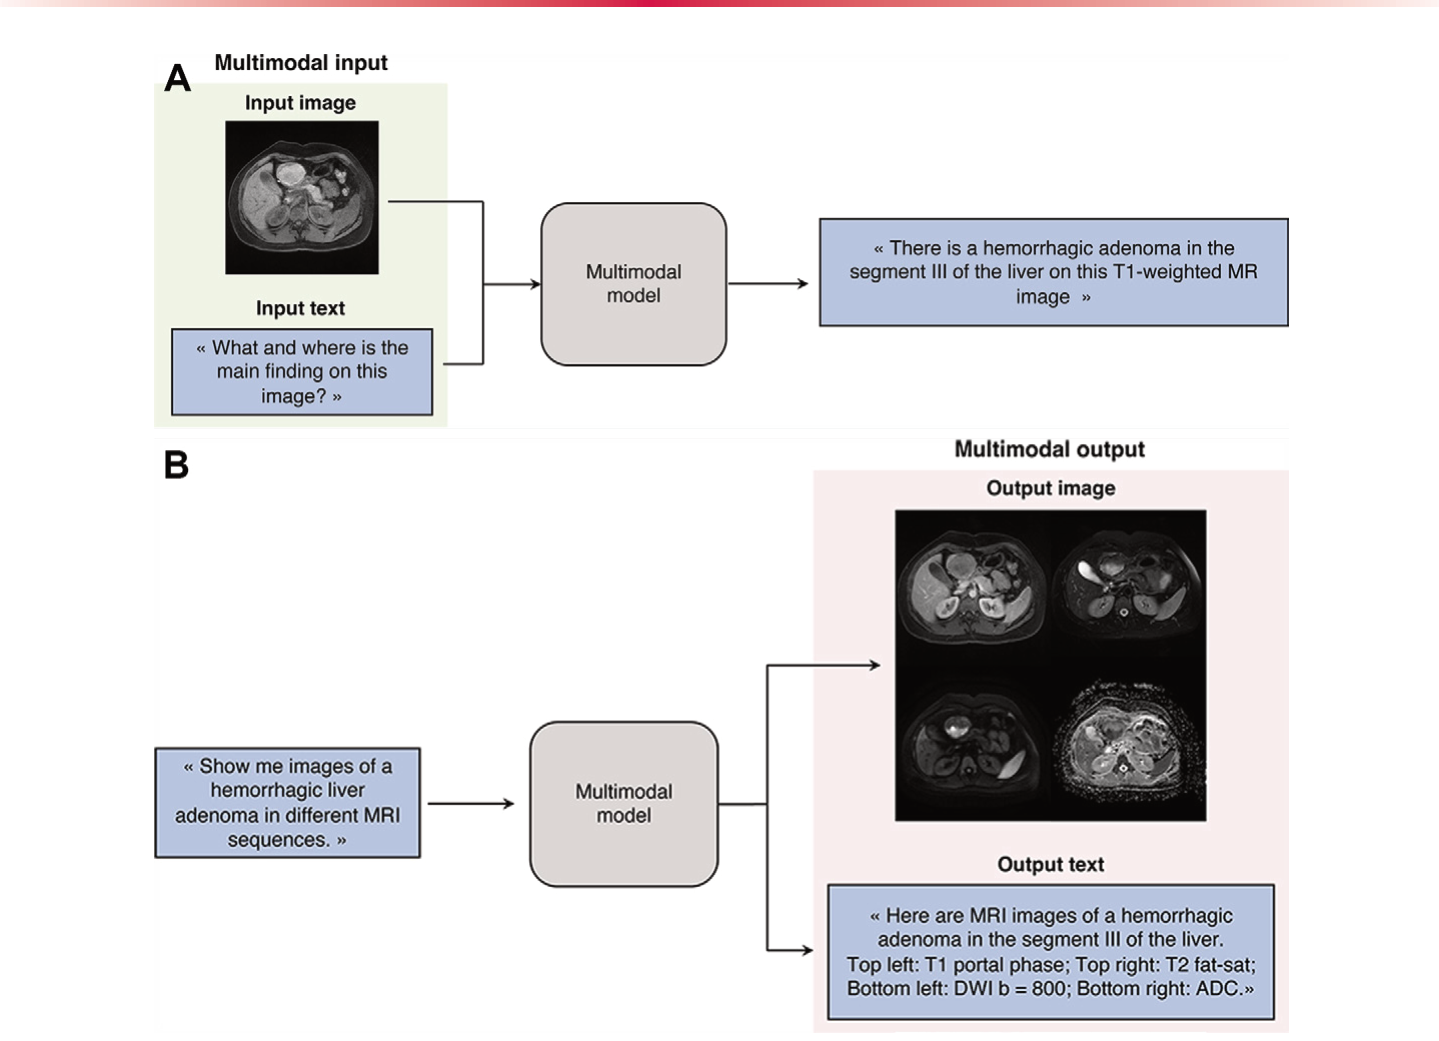
Figure 13. Figure 13. Illustrations show multimodal models. In multimodal models, the input, the output, or both the inputs and output are multimodal. This means that the model can process both image and text data (A), generate both image and text data (B), or process and generate both image and text data (not shown). Imag- es and text are used to show this multimodality, but these models can extend to other types of data, such as video, audio, frequency, and sequencing data. ADC = apparent diffusion coefficient, DWI = diffusion-weighted imaging, fat-sat = fat-saturated, T1 = T1-weighted, T2 = T2-weighted.解説: この図は、マルチモーダルモデルを示しています。マルチモーダルモデルでは、入力、出力、またはその両方がマルチモーダルです。つまり、モデルは画像とテキストの両方のデータを処理したり(A)、画像とテキストの両方のデータを生成したりできます(B)。
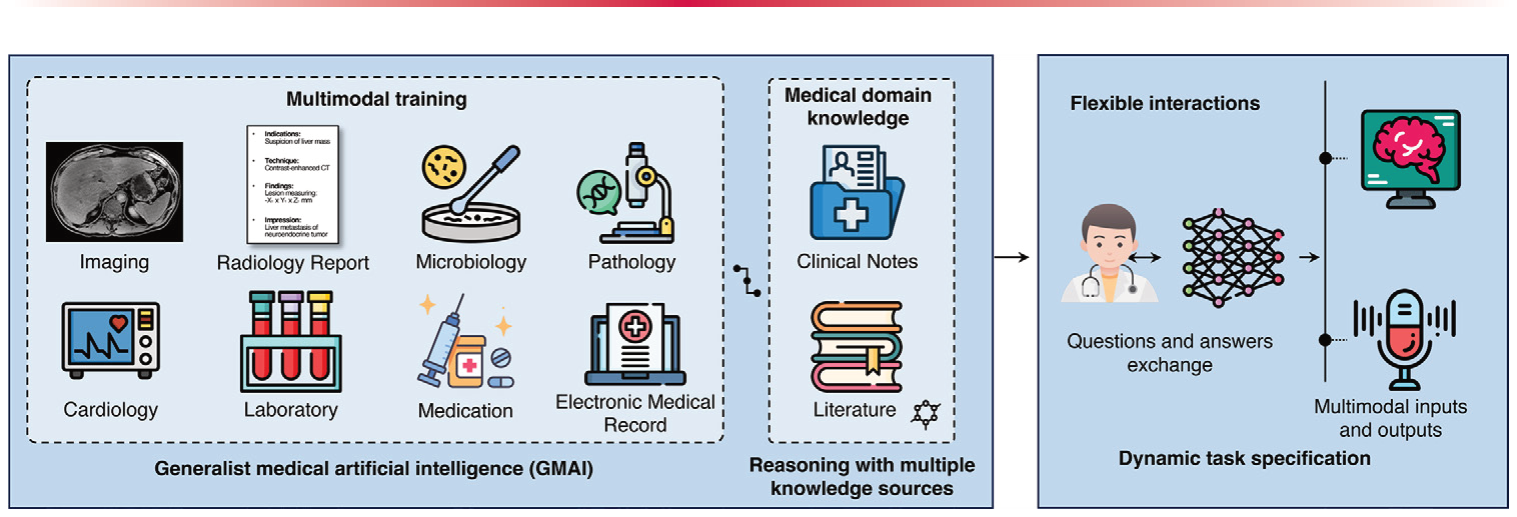
Figure 14. Figure 14. Illustration shows an overview of a generalist medicine AI (GMAI) model pipeline. A GMAI model is trained through techniques such as self-supervised learning on various types of medical data such as imaging, laboratory results, and electronic medical records. To perform clini- cal reasoning, the model accesses a variety of available medical knowledge including the medical literature and clinical notes. The model can then generate outputs based on inputs that the physician provides (67). (Icons made by surang, Freepik, max.icons, RaftelDesign, and Smashi- cons from www.flaticon.com.)解説: この図は、汎用医療AI(GMAI)モデルのパイプラインの概要を示しています。GMAIモデルは、画像、検査結果、電子カルテなど様々な種類の医療データに対し、自己教師あり学習などの技術で訓練されます。モデルは、医学文献や臨床ノートを含む様々な利用可能な医学知識にアクセスして臨床推論を実行します。

コメントを残す