どうも、Beyond the Pixelです。AI(人工知能)技術の進歩は、医療画像診断の領域にも大きな変革をもたらしています。特に、変性性関節疾患のような骨関節疾患の診断においては、関節の代謝活動を精密に定量化することが、病態の早期発見や進行度評価の鍵となります。しかし、これまでの手動での解析手法は、時間がかかり、結果の標準化が難しいという課題を抱えていました。本研究は、AIを活用した自動関節セグメンテーション手法を開発し、陽電子放出断層撮影(PET)とコンピューター断層撮影(CT)を組み合わせた画像から、[¹⁸F]FDG(放射性フッ素標識ブドウ糖)および[¹⁸F]NaF(放射性フッ素標識フッ化ナトリウム)という2種類のトレーサーの取り込みを効率的かつ標準化された方法で定量化するアプローチを提案しています。これにより、関節の分子レベルでの変化を捉え、変性性関節疾患の早期発見や病態評価の精度向上が期待されます。本記事では、この画期的な研究について、医療画像インフォマティクスの専門家として詳しく解説していきます。
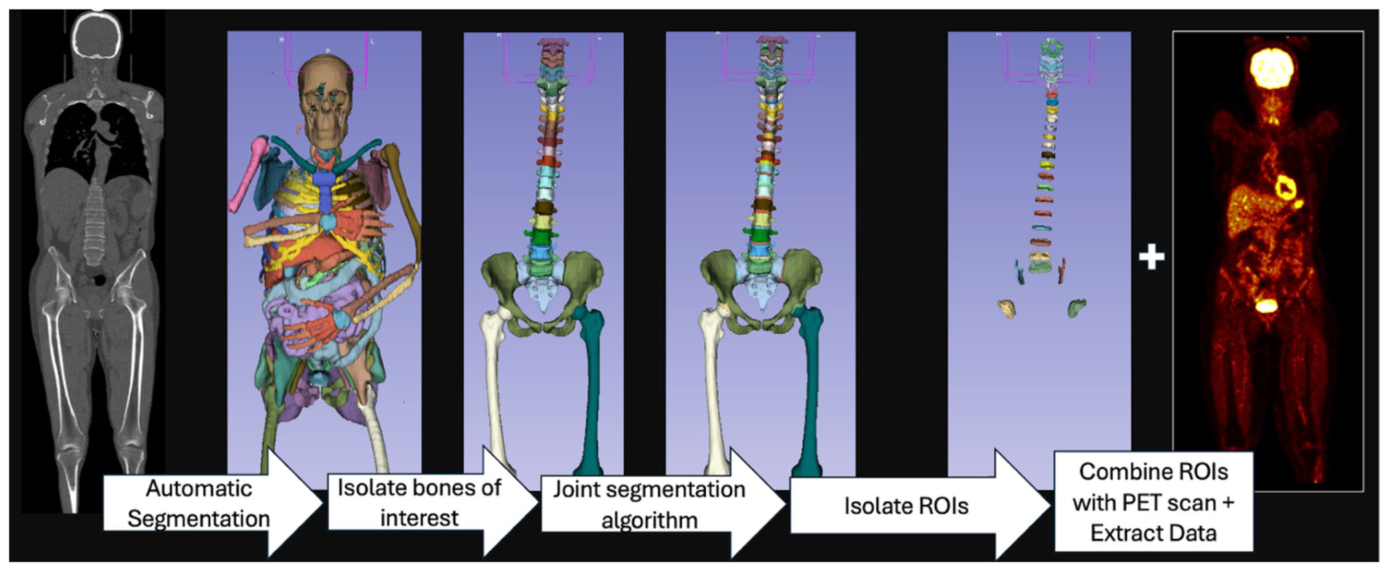
Figure 1. Fig. 1 Segmentation and statistical analysis workflow. TotalSegmen tator is used to generate an initial segmentation from the CT scan. Bones surrounding the joints of interest are then isolated, followed by application of a joint isolation algorithm to define regions of interest解説: 図1は、本研究で開発されたセグメンテーションと統計解析のワークフローを示しています。まずCTスキャンからTotalSegmentatorを用いて初期セグメンテーションを行い、次に目的の関節周辺の骨を分離します。その後、関節分離アルゴリズムを適用して関心領域(ROI)を定義し、これらのROIを対応するPETスキャンに重ね合わせ、平均標準化取り込み値(SUVmean)を計算します。
本研究は、オデッセ大学病院で2012年から2014年にかけて実施された前向き研究「Cardiovascular Molecular Calcification Assessed by NaF PET/CT (CAMONA)」から得られたデータを活用した、後ろ向きの横断研究です。分析には、75名の対象者にはFDGスキャンが、80名の対象者にはNaFスキャンが実施され、いずれも健康なボランティアのデータが用いられました。対象者の年齢は21歳から75歳までと幅広く(平均44.6歳)、BMI(Body Mass Index:肥満度を示す体格指数)も平均26.5と多様な層が含まれています。この幅広い年齢層とBMIを持つ対象者のデータを用いることで、関節の代謝活動とこれらの身体指標との関連性を詳細に分析することが可能になりました。
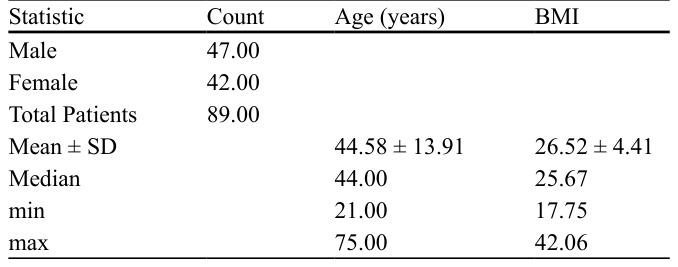
Table 1. Table 1 Clinical Characteristics: The table summarizes demographic and clinical characteristics stratified by sex, including the total num ber of patients and descriptive statistics (mean ± SD, median, min, and max) for age and BMI Statistic Count Age (years) BMI Male 47.00 Female 42.00 Total Patients 89.00 Mean ± SD 44.58 ± 13.91 26.52 ± 4.41 Median 44.00 25.67 min 21.00 17.75 max 75.00 42.06解説: 表1は、性別で層別化された対象者の人口統計学的および臨床的特徴をまとめたものです。総対象者数、および年齢とBMIに関する記述統計(平均±標準偏差、中央値、最小値、最大値)が示されています。
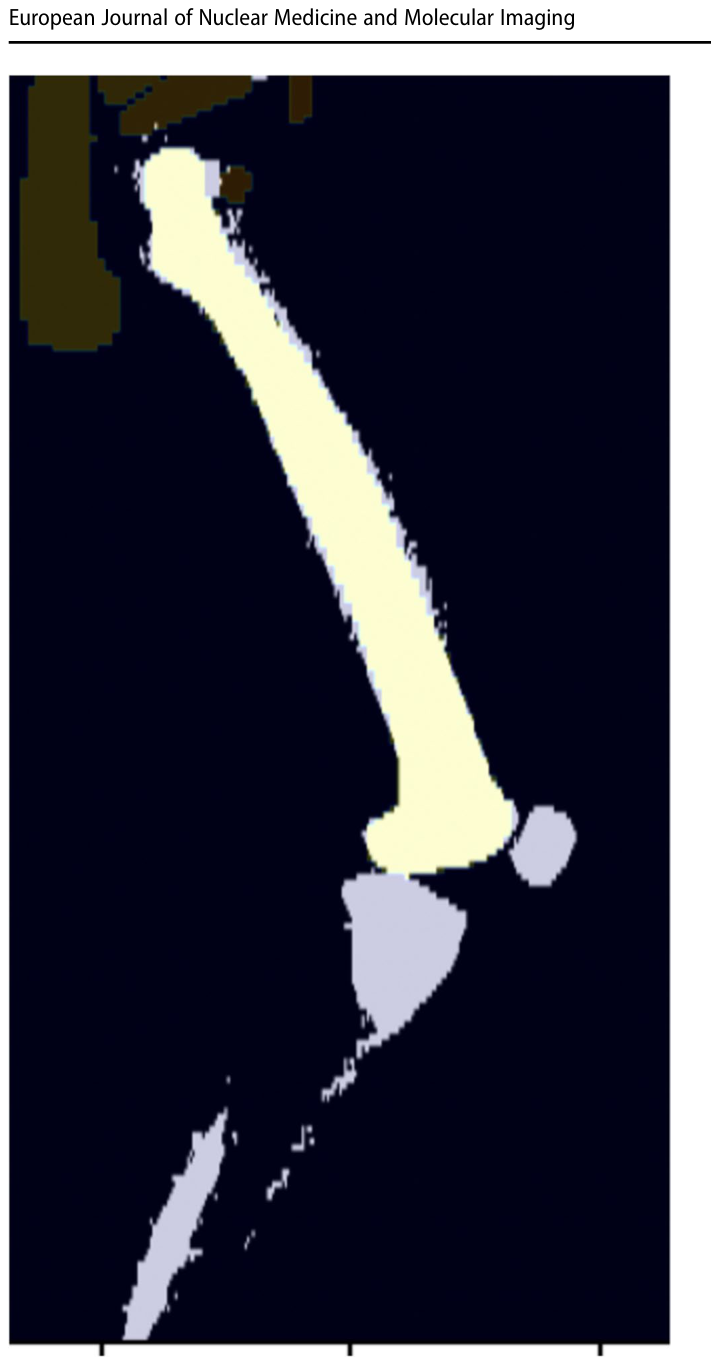
Figure 5. Fig. 5 Overlap of femoral bone segmentations on CT used for accu racy assessment. The blue region is the bone mask obtained by Houn sfield unit (HU) thresholding, which served as the reference, and the yellow region is the segmentation generated by TotalSegmentator, which was the output under evaluation. Overlapping regions indicate agreement between methods, while non-overlapping regions highlight areas of discrepancy. Accuracy was quantified as a one-sided overlap (containment index), defined as the proportion of the TotalSegmen tator segmentation contained within the HU-derived bone mask, as described in the Methods. Other structures shown in this figure (fibula, tibia, patella) can be ignored as they were not involved in segmenta tion analysis解説: 図5は、精度評価に使用されたCT画像上の大腿骨セグメンテーションの重なりを示しています。青色の領域はHounsfield Unit(HU)閾値処理によって得られた骨マスク(参照標準)、黄色の領域はTotalSegmentatorによって生成されたセグメンテーション(評価対象)です。重なる領域は両手法間の一致を示し、重ならない領域は不一致を示します。
図5は、精度評価に使用されたCT画像上の大腿骨セグメンテーションの重なりを示しています。青色の領域はHU閾値処理によって得られた骨マスク(参照標準)、黄色の領域はTotalSegmentatorによって生成されたセグメンテーション(評価対象)です。さらに、同一対象者で異なる日に取得された2回のPET/CTセッション(FDGとNaF)から独立して生成された関節ROIの体積は、高い一致度を示しました(中央値ピアソン相関係数 r = 0.98、中央値級内相関係数 0.94)。これは、本手法が異なる取得条件下でも安定して再現性のあるROIを生成できることを示しています。この高い再現性は、手動セグメンテーションにつきものの観察者間のばらつきを排除し、研究結果の信頼性を大幅に向上させます。
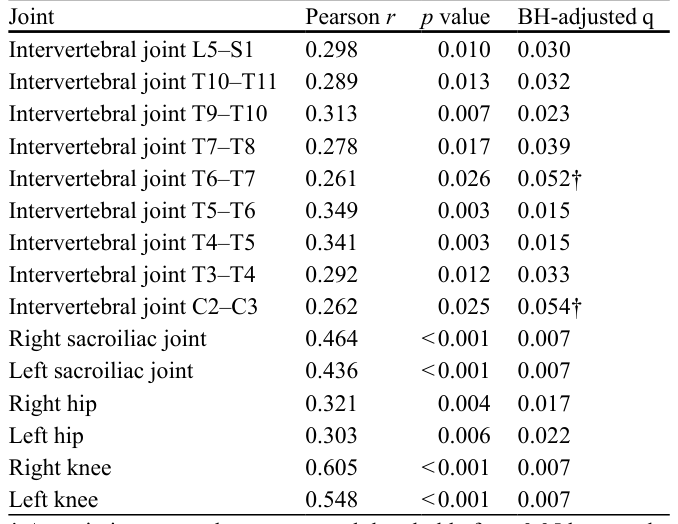
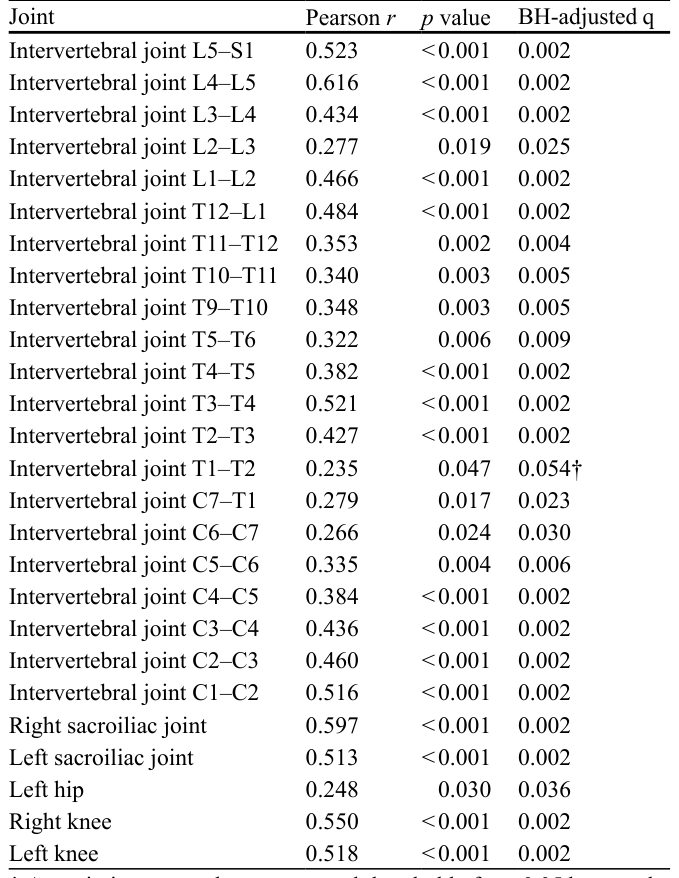
Table 2. Table 2 NaF vs. BMI: Regions with significant correlations between BMI and NaF uptake. Pearson correlation coefficients (r) and corre sponding p-values are shown for anatomical regions where a signifi cant correlation (p < 0.05) was observed between BMI and NaF uptake. Benjamini–Hochberg FDR-adjusted q values are reported alongside the uncorrected p values; associations meeting p < 0.05 but not q < 0.05 are indicated Joint Pearson r p value BH-adjusted q Intervertebral joint L5–S1 0.298 0.010 0.030 Intervertebral joint T10–T11 0.289 0.013 0.032 Intervertebral joint T9–T10 0.313 0.007 0.023 Intervertebral joint T7–T8 0.278 0.017 0.039 Intervertebral joint T6–T7 0.261 0.026 0.052† Intervertebral joint T5–T6 0.349 0.003 0.015 Intervertebral joint T4–T5 0.341 0.003 0.015 Intervertebral joint T3–T4 0.292 0.012 0.033 Intervertebral joint C2–C3 0.262 0.025 0.054† Right sacroiliac joint 0.464 < 0.001 0.007 Left sacroiliac joint 0.436 < 0.001 0.007 Right hip 0.321 0.004 0.017 Left hip 0.303 0.006 0.022 Right knee 0.605 < 0.001 0.007 Left knee 0.548 < 0.001 0.007 † Association meets the uncorrected threshold of p < 0.05 but not the Benjamini–Hochberg false discovery rate threshold of q < 0.05, and is interpreted as exploratory. q values were computed within a family of 30 simultaneous tests解説: 表2は、BMIとNaF取り込みの間に有意な相関が認められた解剖学的領域を示しています。ピアソン相関係数(r)と対応するp値、およびBenjamini-Hochberg FDR補正後のq値が示されています。
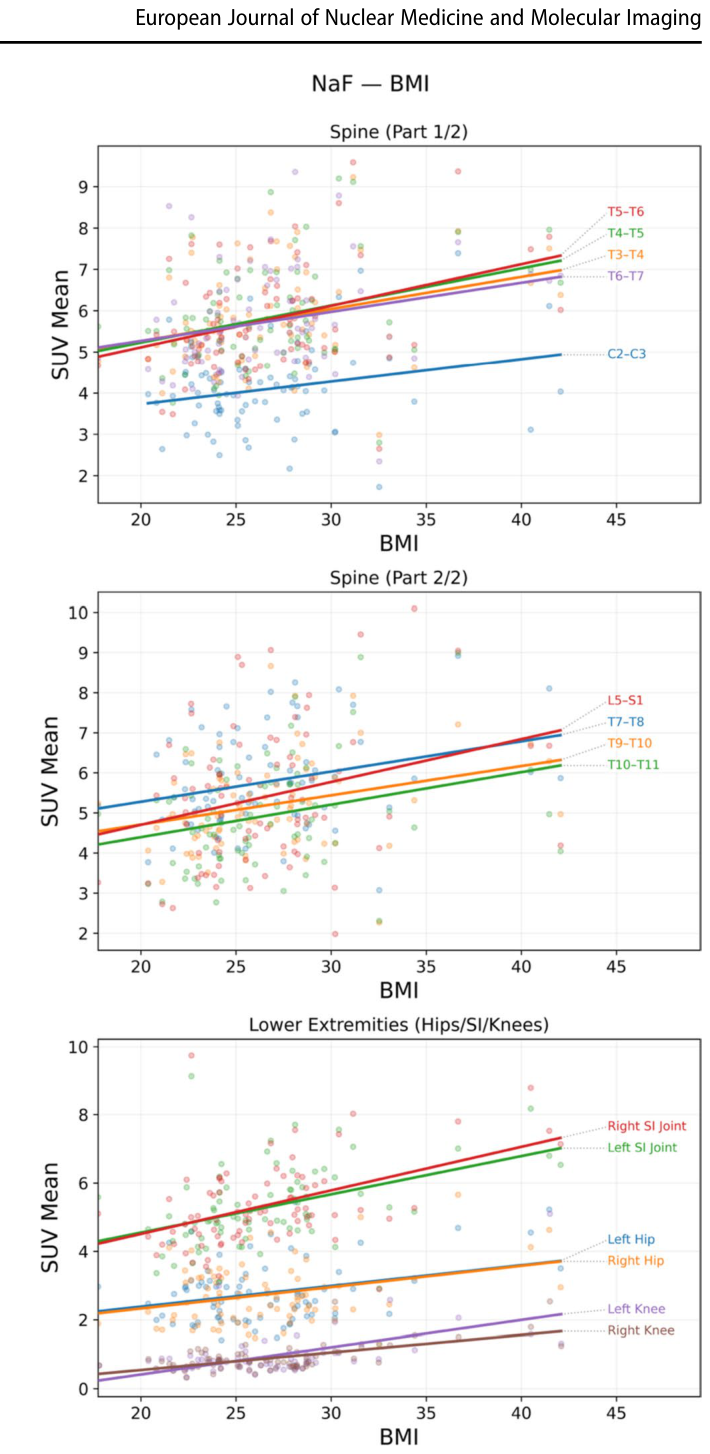
Figure 6. Fig. 6 NaF vs. BMI Vertebral, Hip, SI, and Knee Regions: Positive correlation between BMI and NaF uptake across multiple joint and disk regions. Scatter plots show SUVs of NaF versus BMI for: ver tebral IVDs, SI, hip, and knee joints. All regions demonstrated sig nificant positive correlations between BMI and NaF uptake. For each significant quantified region, a linear regression trend line was overlaid on the scatter plots to represent the relationship between SUV and BMI解説: 図6は、脊椎、股関節、仙腸関節、膝関節におけるBMIとNaF取り込みとの間の正の相関関係を示しています。散布図は、NaFの標準化取り込み値(SUV)をBMIに対してプロットしており、すべての領域でBMIとNaF取り込みの間に有意な正の相関が示されています。
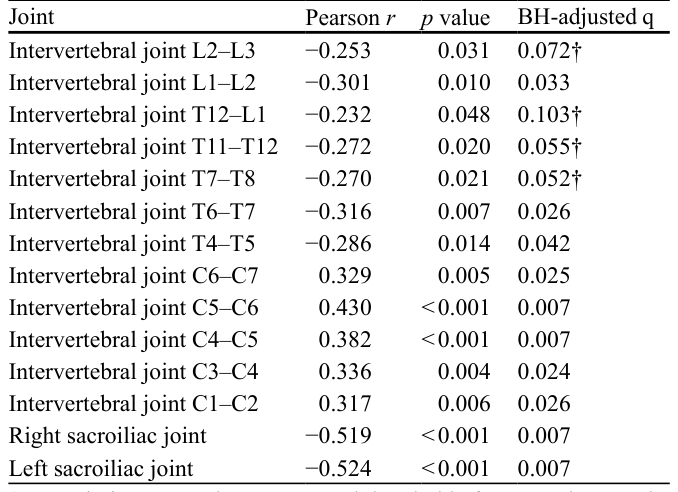
Table 4. Table 4 NaF vs. Age: Regions with significant correlations between age and NaF uptake. Pearson correlation coefficients (r) and corre sponding p-values are shown for anatomical regions where a signifi cant correlation (p < 0.05) was observed between age and NaF uptake. Benjamini–Hochberg FDR-adjusted q values are reported alongside the uncorrected p values; associations meeting p < 0.05 but not q < 0.05 are indicated Joint Pearson r p value BH-adjusted q Intervertebral joint L2–L3 −0.253 0.031 0.072† Intervertebral joint L1–L2 −0.301 0.010 0.033 Intervertebral joint T12–L1 −0.232 0.048 0.103† Intervertebral joint T11–T12 −0.272 0.020 0.055† Intervertebral joint T7–T8 −0.270 0.021 0.052† Intervertebral joint T6–T7 −0.316 0.007 0.026 Intervertebral joint T4–T5 −0.286 0.014 0.042 Intervertebral joint C6–C7 0.329 0.005 0.025 Intervertebral joint C5–C6 0.430 < 0.001 0.007 Intervertebral joint C4–C5 0.382 < 0.001 0.007 Intervertebral joint C3–C4 0.336 0.004 0.024 Intervertebral joint C1–C2 0.317 0.006 0.026 Right sacroiliac joint −0.519 < 0.001 0.007 Left sacroiliac joint −0.524 < 0.001 0.007 † Association meets the uncorrected threshold of p < 0.05 but not the Benjamini–Hochberg false discovery rate threshold of q < 0.05, and is interpreted as exploratory. q values were computed within a family of 30 simultaneous tests解説: 表4は、年齢とNaF取り込みの間に有意な相関が認められた解剖学的領域を示しています。ピアソン相関係数(r)と対応するp値、およびBenjamini-Hochberg FDR補正後のq値が示されています。
表4は、年齢とNaF取り込みの間に有意な相関が認められた解剖学的領域を示しています。
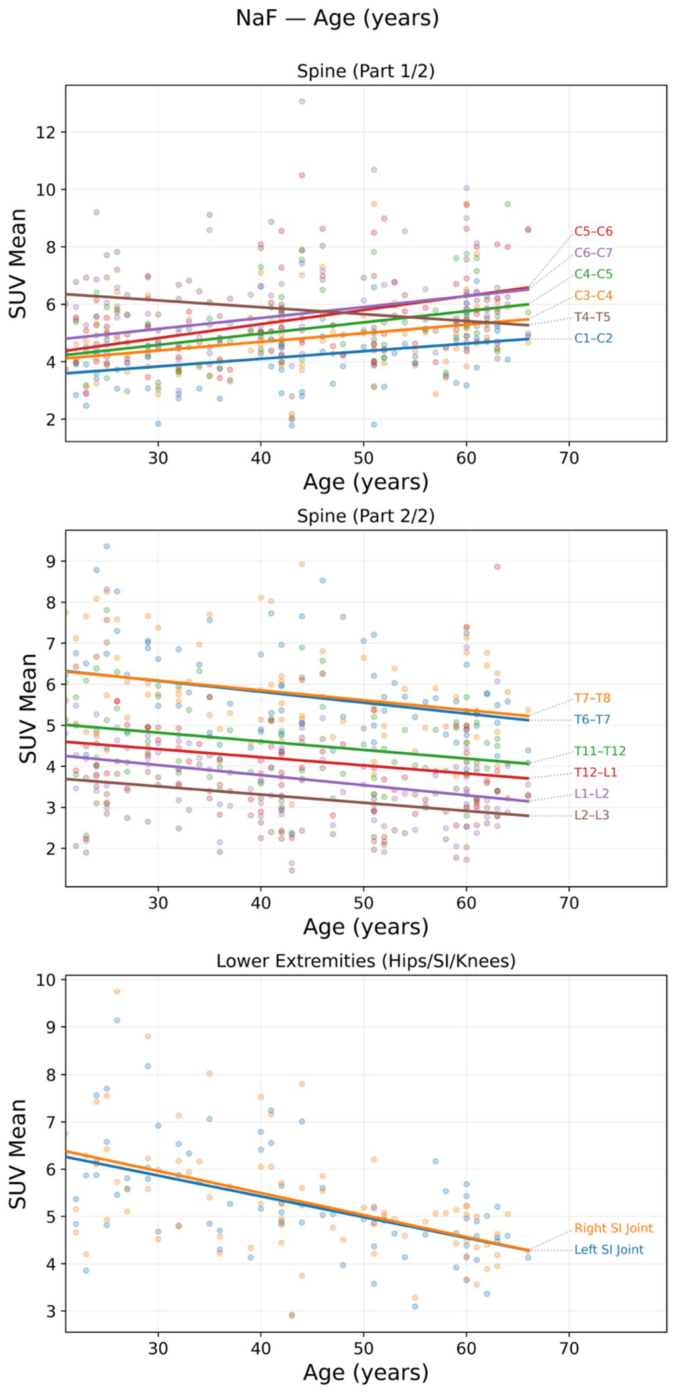
Figure 8. Fig. 8 NaF vs. Age: Significant correlations between age and NaF uptake in vertebral IVDs and SI joints. Scatter plots show SUVs of NaF versus age for IVDs in the spine that were found to have signifi cant positive or negative correlations. For each significant quantified region, a linear regression trend line was overlaid on the scatter plots to represent the relationship between SUV and age解説: 図8は、脊椎の椎間板(IVD)および仙腸関節(SI関節)における年齢とNaF取り込みとの間の有意な相関関係を示しています。散布図は、NaFの標準化取り込み値(SUV)を年齢に対してプロットしており、有意な正または負の相関が見られた脊椎の椎間板の領域に対して線形回帰トレンドラインが重ねられています。
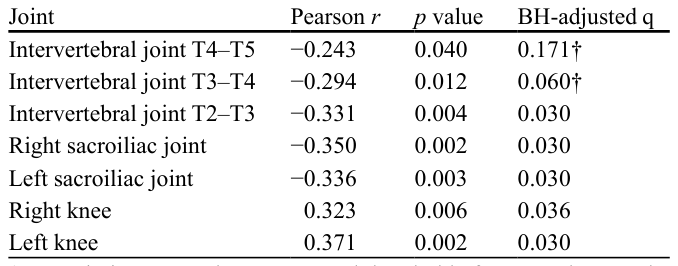
Table 5. Table 5 FDG vs. Age: Regions with significant correlations between age and FDG uptake. Pearson correlation coefficients (r) and corre sponding p-values are shown for anatomical regions where a signifi cant correlation (p < 0.05) was observed between age and FDG uptake. Benjamini–Hochberg FDR-adjusted q values are reported alongside the uncorrected p values; associations meeting p < 0.05 but not q < 0.05 are indicated Joint Pearson r p value BH-adjusted q Intervertebral joint T4–T5 −0.243 0.040 0.171† Intervertebral joint T3–T4 −0.294 0.012 0.060† Intervertebral joint T2–T3 −0.331 0.004 0.030 Right sacroiliac joint −0.350 0.002 0.030 Left sacroiliac joint −0.336 0.003 0.030 Right knee 0.323 0.006 0.036 Left knee 0.371 0.002 0.030 † Association meets the uncorrected threshold of p < 0.05 but not the Benjamini–Hochberg false discovery rate threshold of q < 0.05, and is interpreted as exploratory. q values were computed within a family of 30 simultaneous tests解説: 表5は、年齢とFDG取り込みの間に有意な相関が認められた解剖学的領域を示しています。ピアソン相関係数(r)と対応するp値、およびBenjamini-Hochberg FDR補正後のq値が示されています。
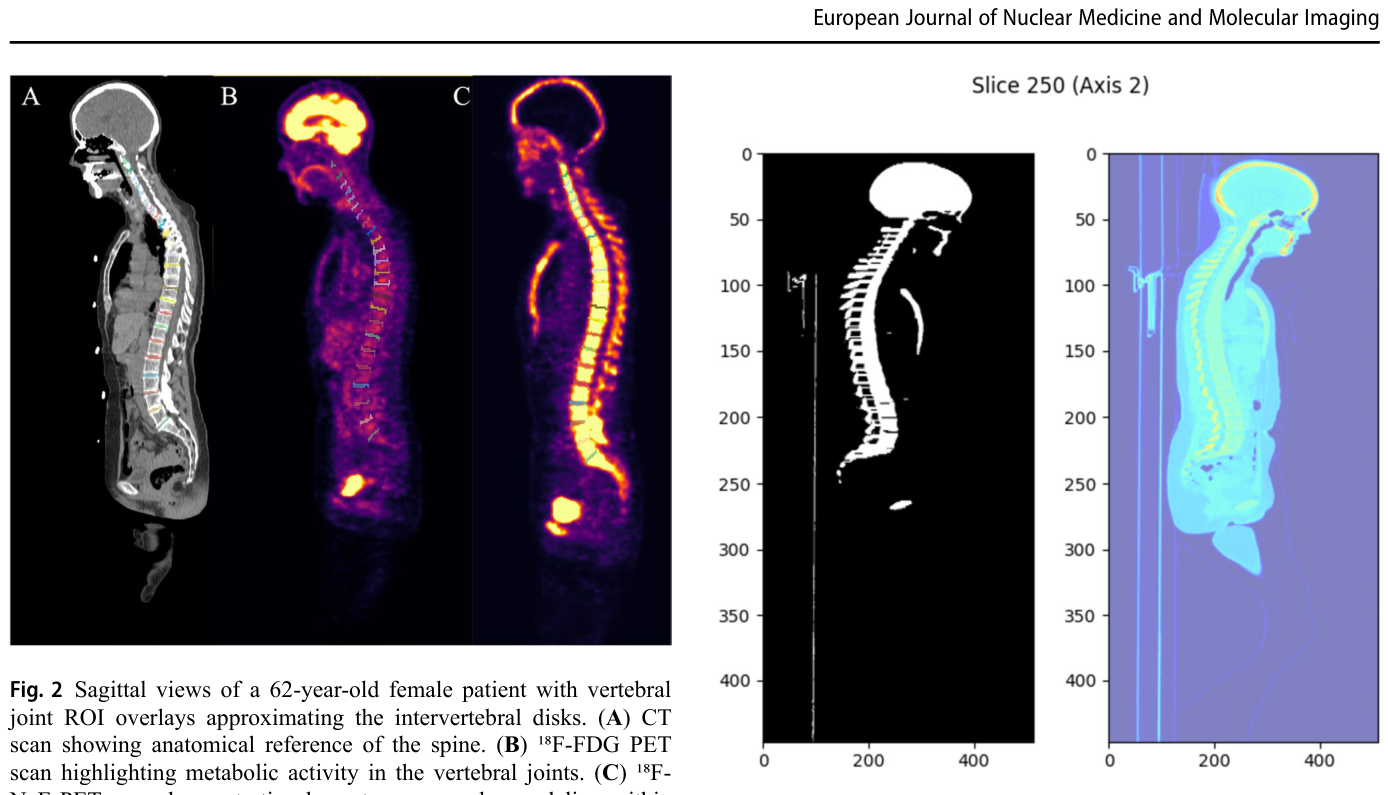
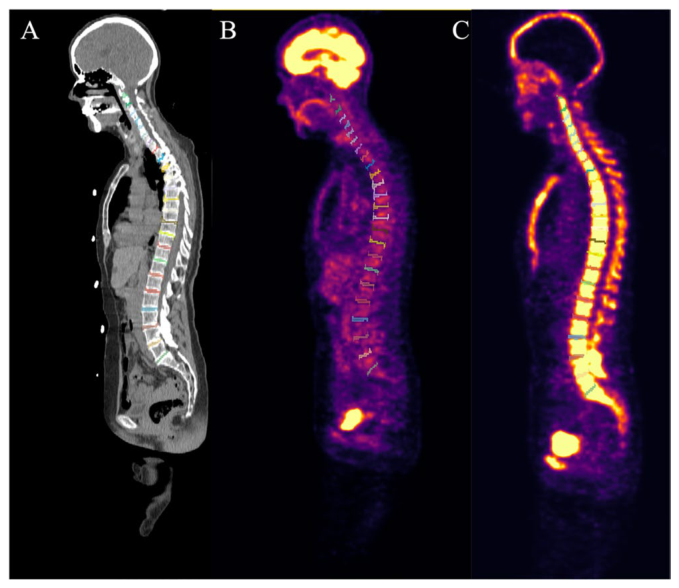
Figure 2. Fig. 2 Sagittal views of a 62-year-old female patient with vertebral joint ROI overlays approximating the intervertebral disks. (A) CT scan showing anatomical reference of the spine. (B) ¹⁸F-FDG PET scan highlighting metabolic activity in the vertebral joints. (C) ¹⁸F- NaF PET scan demonstrating bone turnover and remodeling within the same ROIs解説: 図2は、62歳女性対象者の椎間関節の関心領域(ROI)を椎間板に近似して重ね合わせた矢状断面図です。(A)は脊椎の解剖学的基準を示すCTスキャン、(B)は椎間関節の代謝活動を強調する¹⁸F-FDG PETスキャン、(C)は同じROI内での骨代謝回転とリモデリングを示す¹⁸F-NaF PETスキャンです。
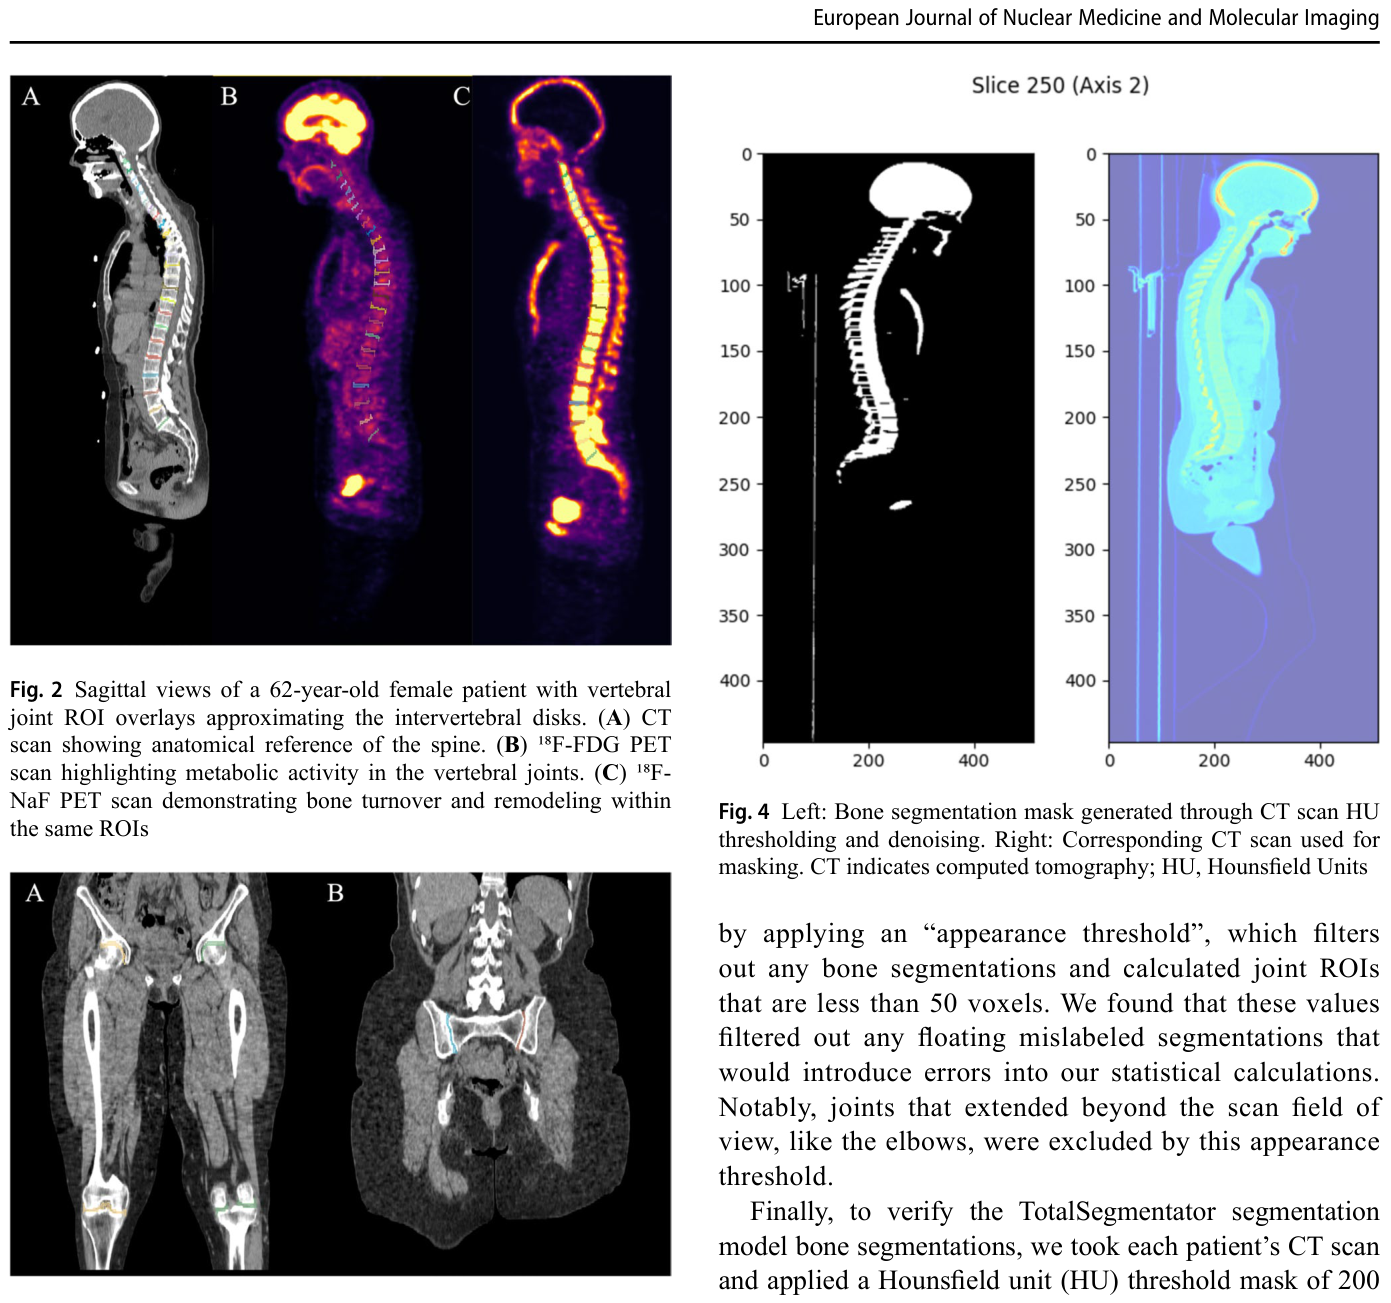
Figure 3. Fig. 3 Coronal CT scans of a 62-year-old female patient with (A) hip and knee joint ROIs and (B) SI joint ROIs displayed. ROIs are shown as overlays on the anatomical images. CT indicates computed tomog raphy; SI, sacroiliac; ROI, region of interest解説: 図3は、62歳女性対象者の冠状CTスキャン画像で、(A)股関節と膝関節のROI、(B)仙腸関節(SI関節)のROIが表示されています。これらのROIは、解剖学的画像上に重ねて示されています。


コメントを残す