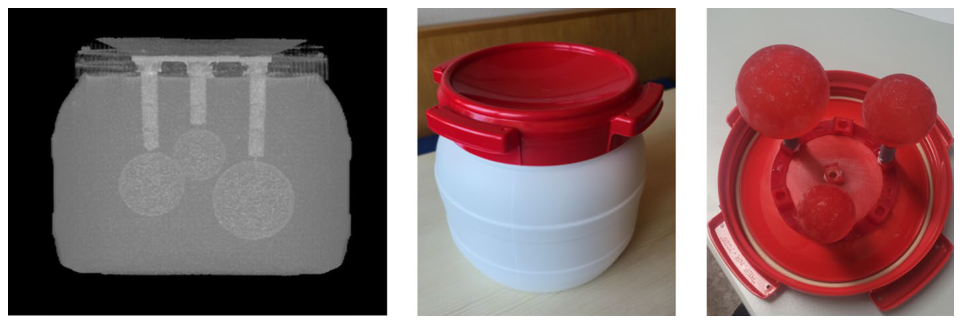
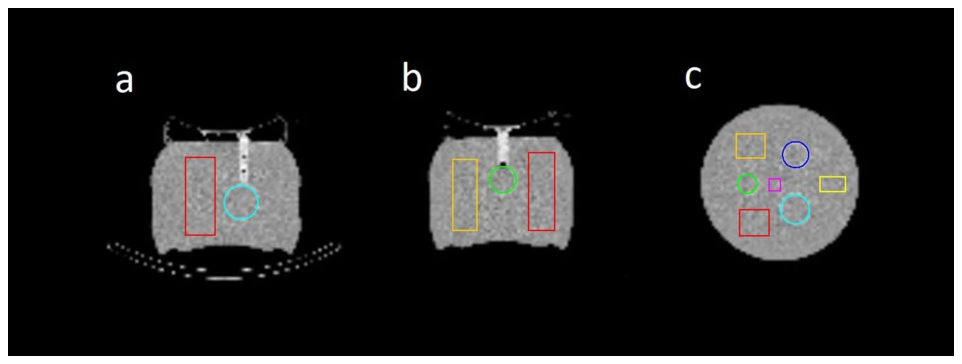
Figure 1. Fig. 1 CT (left), photographs of the self-designed phantom (center) and the three fillable spheres (right)解説: 本図は、本研究で用いられた自己作製ファントムのCT画像(左)、実際のファントム(中央)、およびその中に配置された3Dプリントされた3つの球体(右)を示しています。これらの球体は、異なるサイズの臓器や病変を模擬するために用いられました。Figure 2. Fig. 2 CT scan of the phantom with segmented 3D-printed spheres (blue: 191 ml, cyan: 100 ml, green: 48 ml) and rectangular background VOIs used for CNR calculation (magenta, yellow, orange, red) in (a) axial, (b) sagittal, and (c) coronal views. The volumes of the background VOIs are 54 ml, 145 ml, 260 ml and 280 ml for magenta, yellow, orange and red, respectively解説: 本図は、ファントムのCTスキャン画像に、セグメンテーションされた3Dプリント球体(青:191ml、シアン:100ml、緑:48ml)と、コントラスト対ノイズ比(CNR)計算のために使用された長方形のバックグラウンドVOI(マゼンタ、黄、オレンジ、赤)を軸方向(a)、矢状方向(b)、冠状方向(c)で示しています。
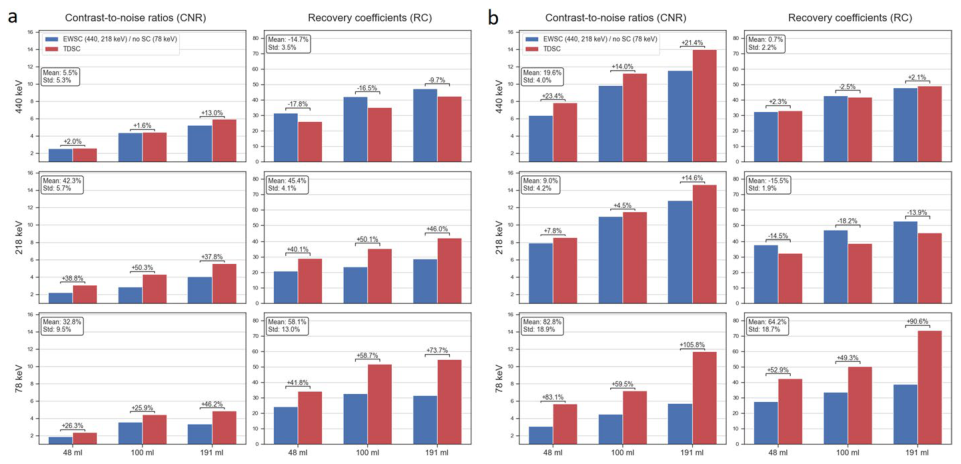
Figure 3. Fig. 3 CNR and RC comparison of TDSC and EWSC (440, 218 keV) / no SC (78 keV) for all three energy windows for the LC (a) and HC (b) cases. The figure includes the percentage changes for CNR and RC for each of the spheres and peaks from EWSC/no SC to TDSC. Additionally, in the text boxes, the mean and standard deviations (Std) of the percentage changes for CNR and RC across all spheres for each of the peaks are shown. All images were filtered using 30 mm FWHM Gaussian filter. No PVC was applied解説: 本図は、低カウント(LC)ケース(a)と高カウント(HC)ケース(b)における、TDSCとEWSC/no SC(78 keV)のコントラスト対ノイズ比(CNR)とリカバリー係数(RC)を、3つのエネルギーウィンドウすべてについて比較したものです。各球体とピークにおけるCNRとRCのパーセンテージ変化が示されています。
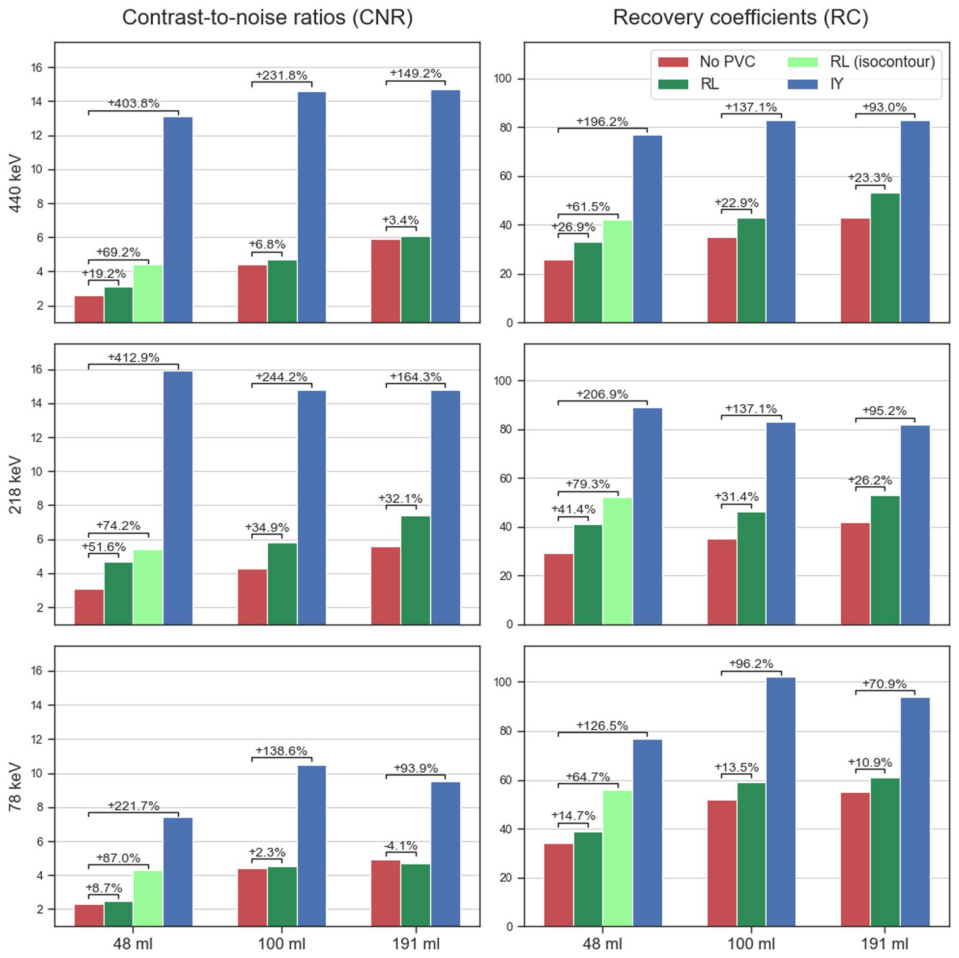
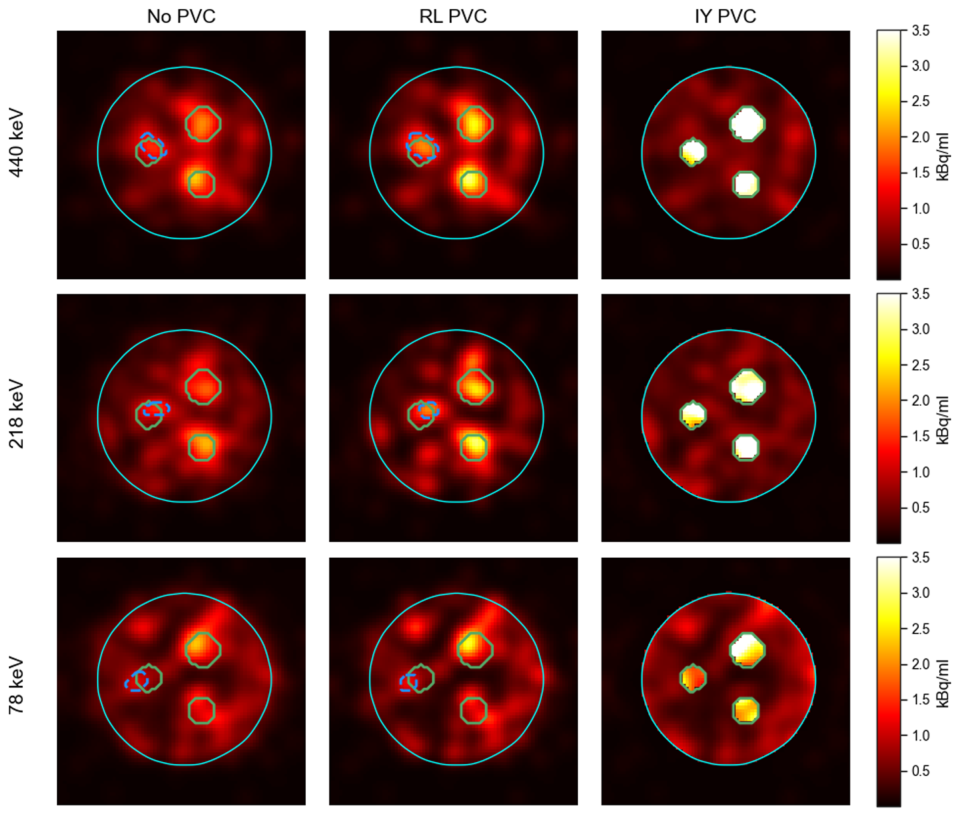
Figure 4. Fig. 4 RC and CNR for no PVC, RL and IY for all spheres in the phantom. For the smallest sphere, RC and CNR ob tained using isocontour segmentations for RL are also shown. The figure includes the percentage changes for CNR and RC for each of the spheres and peaks between no PVC and the PVC methods解説: 本図は、PVCなし、RL、およびIYの各補正を適用した場合のファントム内のすべての球体におけるRCとCNRを示しています。最も小さい球体については、RLでのアイソコントアセグメンテーションを用いて得られたRCとCNRも示されています。Figure 5. Fig. 5 Slices from post-filtered SPECT images of the phantom using no PVC, RL and IY (Gaussian post-filter, 30 mm FWHM) for the three energy windows. The locations of the phantom spheres are shown with green solid lines, the isocontour segmentations for the smallest sphere for RL-based and non-PVC images with dashed blue lines, and the phantom’s background volume with cyan solid line解説: 本図は、PVCなし、RLおよびIY(ガウスフィルター適用後)の3つのエネルギーウィンドウに対応するファントムSPECTの断層画像です。ファントム球体の位置は緑の実線で、RLベースおよび非PVC画像における最小球体のアイソコントアセグメンテーションは破線の青線で示されています。
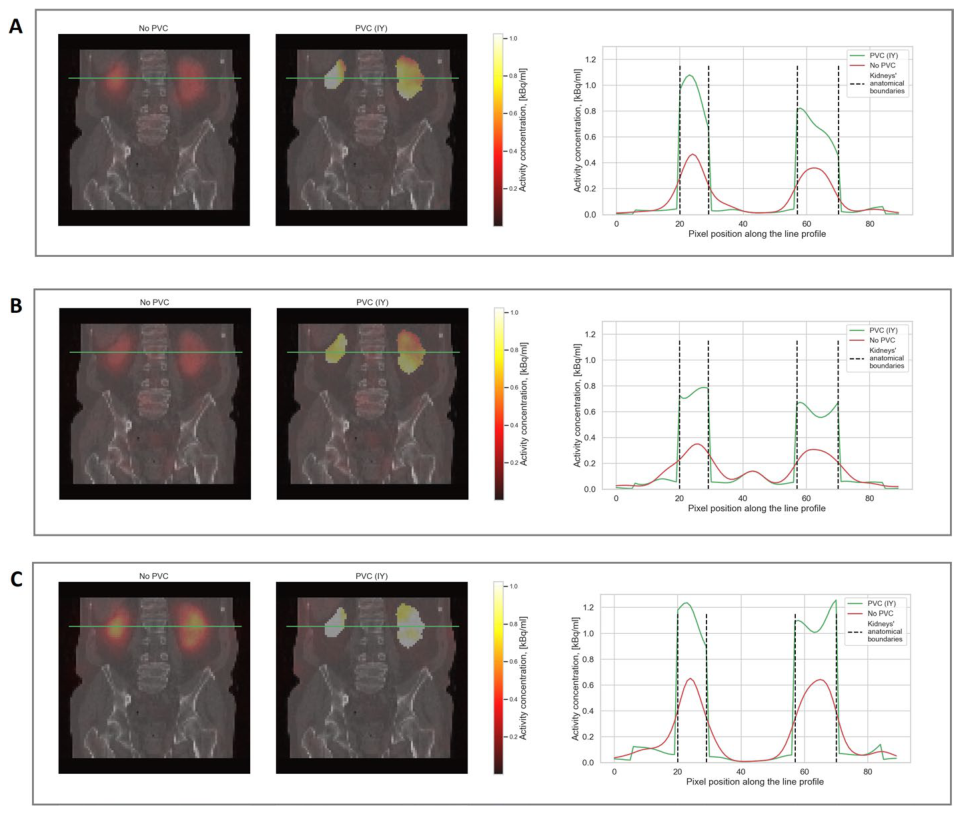
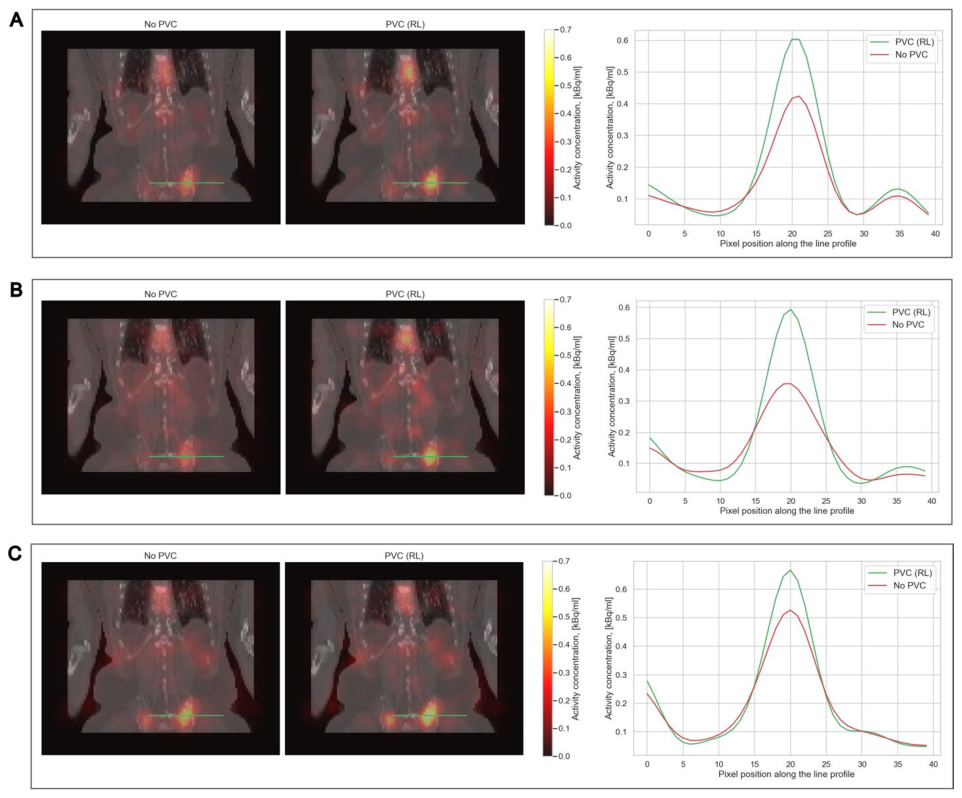
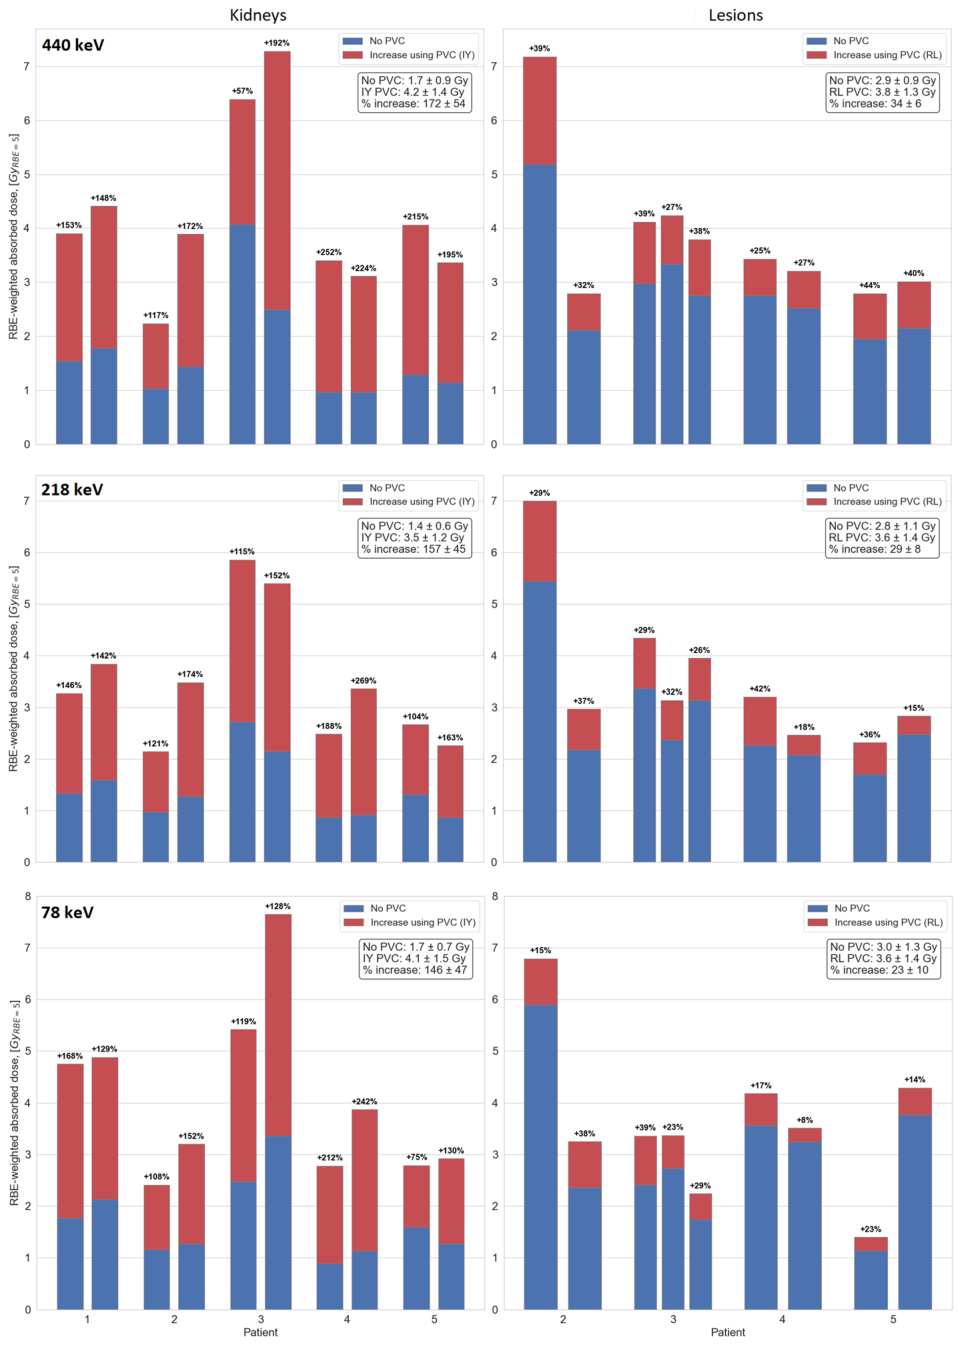
Figure 6. Fig. 6 SPECT/CT slices from all three energy windows (A: 440 keV, B: 218 keV, C: X-rays) of patient 1 (Fig. 8) using no PVC and IY. The green lines on the SPECT/CT images indicate the location through which the activity profiles were taken. All SPECT images were filtered using 30 mm FWHM Gaussian filter解説: 本図は、対象者1の3つのエネルギーウィンドウ(A: 440 keV, B: 218 keV, C: X線)のSPECT/CT断層画像で、PVCなしとIYベースのPVC適用後を比較しています。SPECT/CT画像上の緑線は、活動量プロファイルが取得された位置を示しています。Figure 7. Fig. 7 SPECT/CT slices from all three energy windows (A: 440 keV, B: 218 keV, C: X-rays) patient 5 (Fig. 8) using no PVC and RL. The green lines on the SPECT/CT images indicate the location through which the activity profiles were taken. All SPECT images were filtered using 30 mm FWHM Gaussian filter解説: 本図は、対象者5の3つのエネルギーウィンドウ(A: 440 keV, B: 218 keV, C: X線)のSPECT/CT断層画像で、PVCなしとRLベースのPVC適用後を比較しています。SPECT/CT画像上の緑線は、活動量プロファイルが取得された位置を示しています。Figure 8. Fig. 8 RBE-weighted kidney (left) and lesion (right) absorbed doses for all three energy windows with and without PVC. The increase of RBE-weighted absorbed doses, obtained when using PVC SPECT, is shown as red bars and the resulting RBE-weighted absorbed doses are represented by the sum of the blue and red bar heights解説: 本図は、PVC適用前後における、すべての3つのエネルギーウィンドウでのRBE加重腎臓(左)および病変(右)の吸収線量を示しています。青い棒はPVCなしの吸収線量を、赤い棒はPVC適用による吸収線量の増加を示しています。

コメントを残す